
Visit www.equality-of-opportunity.org for the full paper, college-level data, and more
The Equality of Opportunity Project
0%
20% 40% 60%
80%
Percent of Students
1 2 3 4 5
Parent Income Quintile
SUNY-Stony Brook
Columbia
Top 1%
13.7%
Top 1%
0.4%
Access: Pct. of Students from each
fifth of the Parent Income Distribution
Success Rates: Pct. of Students
with Earnings in Top Fifth
Mobility Report Cards: The Role of Colleges in Intergenerational Mobility
Raj Chetty, John N. Friedman, Emmanuel Saez, Nicholas Turner, and Danny Yagan
Which colleges in America contribute the most to helping children climb the income ladder?
How can we increase access to such colleges for children from low income families? We take a
step toward answering these questions by constructing publicly available
mobility report cards
– statistics on students’ earnings in their early thirties and their parents’ incomes – for each
college. We estimate these statistics using de-identified data from the federal government
covering all students from 1999-2013, building on the Dept. of Education’s College Scorecard.
Mobility Report Cards for Columbia and SUNY-Stony Brook
Using these mobility report cards, we document four results.
1. Access. Access to colleges varies substantially across the income distribution, for example as
shown between Columbia and SUNY-Stony Brook in the figure above. At “Ivy-Plus” colleges (Ivy
League colleges, U. Chicago, Stanford, MIT, and Duke), more students come from families in the
top 1% of the income distribution than the bottom half of the income distribution. Despite the
generous financial aid offered by these institutions, students from the lowest-income families
are particularly under-represented, even relative to middle-income students. Children with
parents in the top 1% are 77 times more likely to attend an Ivy-Plus college than children with
parents in the bottom 20%. More broadly, looking across all colleges, the degree of income
segregation is comparable to income segregation across neighborhoods in the average
American city. These findings challenge the perception that colleges foster interaction between
children from diverse socioeconomic backgrounds.
Note: Bars show estimates of the fraction of parents in each quintile of the
income distribution. Lines show estimates of the fraction of students from
each of those quintiles who reach the top quintile as adults.

Mobility Report Cards: Executive Summary
Visit www.equality-of-opportunity.org for the full paper, college-level data, and more
2. Outcomes. At any given college, students from low- and high- income families have very
similar earnings outcomes. For example, about 60% of students at Columbia reach the top fifth
from both low and high income families. In this sense, colleges successfully “level the playing
field” across enrolled students with different socioeconomic backgrounds. This finding
suggests that students from low-income families who are admitted to selective colleges are not
over-placed, since they do nearly as well as students from more affluent families. This result
also suggests that colleges do not bear large costs in terms of student outcomes for any
affirmative action that they grant students from low-income families in the admissions process.
3. Mobility Rates. We characterize differences in rates of upward mobility between colleges by
defining a college’s upward mobility rate as the fraction of its students who come from a family
in the bottom fifth of the income distribution and end up in the top fifth. Each college’s mobility
rate is the product of access, the fraction of its students who come from families in the bottom
fifth, and its success rate, the fraction of such students who reach the top fifth.
Mobility rates vary substantially across colleges because there are large differences in access
across colleges with similar success rates. Ivy-Plus colleges have the highest success rates, with
almost 60% of students from the bottom fifth reaching the top fifth. But certain less selective
universities have comparable success rates while offering much higher levels of access to low-
income families. For example, 51% of students from the bottom fifth reach the top fifth at
SUNY–Stony Brook. Because 16% of students at Stony Brook are from the bottom fifth
compared with 4% at the Ivy-Plus colleges, Stony Brook has a bottom-to-top-fifth mobility rate
of 8.4%, substantially higher than the 2.2% rate on average at Ivy-Plus colleges.
The colleges that have the highest upward mobility rates, listed in the table below, are typically
mid-tier public schools that have many low-income students and very good outcomes.
Top 10 Colleges by Mobility Rate (from Bottom to Top Quintile)
Note: Table lists highest-mobility-rate colleges with more than 300 students per cohort.
Rank
Name
Mobility Rate
= Access x
Success Rate
1
Cal State
University – LA 9.9% 33.1% 29.9%
2
Pace University
– New York
8.4% 15.2% 55.6%
3
SUNY
– Stony Brook 8.4% 16.4% 51.2%
4
Technical Career Institutes
8.0% 40.3% 19.8%
5
University of Texas
–
Pan American
7.6% 38.7% 19.8%
6
City Univ. of
New York System 7.2% 28.7% 25.2%
7
Glendale Community College
7.1% 32.4% 21.9%
8
South Texas College
6.9% 52.4% 13.2%
9
Cal
State Polytechnic – Pomona 6.8% 14.9% 45.8%
10
University of Texas
– El Paso 6.8% 28.0% 24.4%
Mobility Report Cards: Executive Summary
Visit www.equality-of-opportunity.org for the full paper, college-level data, and more
The differences in mobility rates across colleges are not driven by differences in the
distribution of college majors or other institutional characteristics. The estimates are similar
when we measure children’s income at the household instead of individual level or adjust for
differences in local costs of living.
If we measure “success” in earnings as reaching the top 1% of the income distribution instead
of the top 20%, we find very different patterns. The colleges that channel the most children
from low- or middle-income families to the top 1% are almost exclusively highly selective
institutions, such as UC–Berkeley and the Ivy-Plus colleges, where 13% of students from the
bottom fifth reach the top 1%. No college in the U.S. currently offers a high rate of upper-tail
(top 1%) success while providing very high levels of access to low-income students.
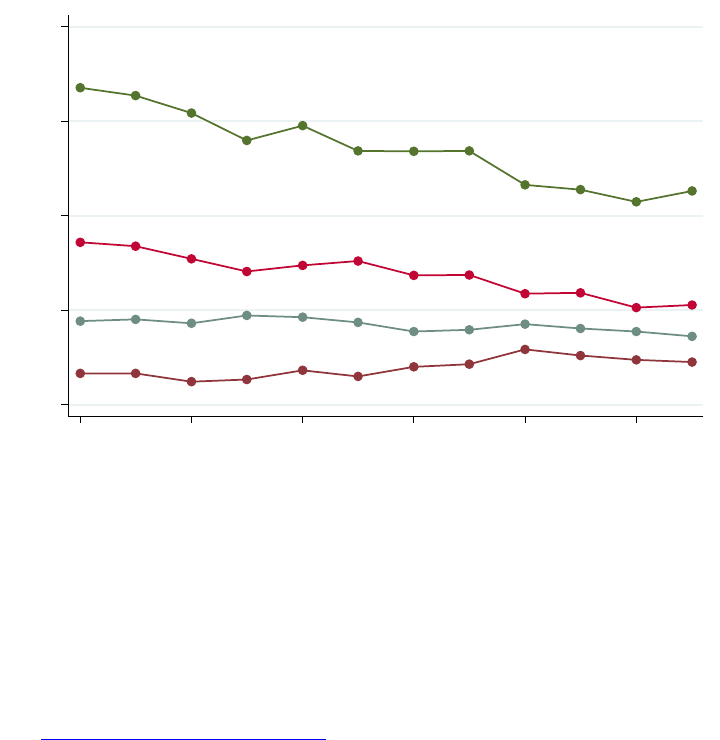
4. Trends. Finally, we examine how access and mobility rates have changed since 2000, when
our data begin. Despite substantial tuition reductions and other outreach policies, the fraction
of students from low-income families at the Ivy-Plus colleges increased very little across a
range of income percentiles (e.g., below the 20
th
, 40
th
, or 60
th
percentile). This is illustrated by
the trend in the fraction of students from the bottom quintile at Harvard in the figure below.
This result does not imply that the increases in financial aid had no effect on access; absent
these changes, the fraction of low-income students might have fallen, especially given that real
incomes of low-income families fell due to widening inequality during the 2000s.
Trends in Low-Income Access from 2000-2011 at Selected Colleges
The increase in our percentile-based measures of access at elite private colleges is smaller than
suggested by the increase in the fraction of students receiving federal Pell grants – a widely-
used proxy for low-income access – because the Pell eligibility threshold rose in the 2000s and
the real income.
Meanwhile, access at institutions with the highest mobility rates (e.g., SUNY-Stony Brook and
Glendale Community College in the figure above) fell sharply over the 2000s, perhaps because
0%
10% 20% 30%
40%
Percent of Parents in the Bottom Quintile
2000 2002 2004 2006 2008 2010
Year when Child was 20
Glendale Community College
SUNY-Stony Brook
UC
-Berkeley
Harvard

Mobility Report Cards: Executive Summary
Visit www.equality-of-opportunity.org for the full paper, college-level data, and more
of reductions in state support or tuition increases. The changes in access were not associated
with significant changes in success rates. Thus, the colleges that may have offered many low-
income students pathways to success are becoming less accessible to them.
***
We caution that this study does not provide guidance on how a given child would do if he or
she were to attend a different college. The differences in outcomes across colleges we report
reflect both the causal effect of attending a college (a college’s “value-added”) and differences
in the abilities and ambitions of students who attend different colleges. In addition, our
estimates naturally do not capture the myriad contributions of higher education beyond
earnings. However, the data highlight certain colleges – such as California State–Los Angeles,
the City University of New York, and University of Texas–El Paso – that have high mobility rates
without being exceptionally selective. These colleges deserve further study as potential engines
of upward mobility.
While our analysis does not provide specific policy prescriptions, it yields a set of lessons that
can help guide efforts to increase upward mobility via higher education. First, low-income
students admitted to selective colleges do not appear over-placed, as their earnings outcomes
are similar to those of their peers from higher income families. This result mitigates the
concern that attending a selective institution may be detrimental for students from
disadvantaged backgrounds, providing support for policies that seek to bring more such
students to selective colleges.
Second, efforts to expand low-income access often focus on elite colleges, such as Ivy League
universities. Although these highly selective colleges have excellent outcomes, expanding
access to the high-mobility-rate colleges identified here may provide a more scalable model for
increasing upward mobility for large numbers of children. The colleges with the highest
mobility rates have annual instructional expenditures less than $6,500 per student on average,
far lower than the $87,000 per student spent on instruction at elite private colleges.
Finally, recent trends in access – a decline at colleges with the highest mobility rates and little
change at elite private colleges despite their efforts to increase financial aid – call for a re-
evaluation of policies at the national, state, and college level. For example, it may be worth
considering changes in admissions criteria or expansions of transfers from the community
college system. In addition, policies that reach students before they begin applying to college –
for example, targeted outreach and mentoring in elementary and middle school – may be
valuable, especially in light of previous evidence
from the Equality of Opportunity Project
demonstrating the importance of childhood environments and elementary education for
upward mobility. We hope the new college-level statistics constructed in this study will help
researchers and policy makers develop and test such policy solutions.
