
Investor Presentation
February 2024
05/05/2022

Introduction
1

3
Vestiaire Collective brings concrete solutions to the
acute challenges of the fashion industry
Challenges of the fashion industry
35% of all oceans’
microplastics
2
10% of greenhouse
gases emissions
1
20% of all global
wastewater
1
Sources:
1
United Nations Environment Programme and the Ellen MacArthur Foundation;
2
Report sent by five NGOs (A Plastic Planet, Matter, PlanetCare, Xeros, and 5 Gyres) to the European Commission (2023);
3
Vestiaire Collective’s impact
report (2023)
Secondhand, first choice:
82% of the items purchased on Vestiaire Collective
prevent a first-hand purchase
3
Much smaller environmental cost:
90% of the environmental cost of a fashion item is saved
by shopping on Vestiaire Collective
3
The upscale effect:
85% of Vestiaire Collective’s users are willing to buy fewer
and better quality items
3
Vestiaire Collective’s positive impact
The fashion industry has become one of the most
polluting industry in the world, representing today…
VC is a climate positive company: the GHG emissions it allows
to avoid amount to c.3x the GHG emissions it actually produces
3

4
Vestiaire Collective has defined a 3-pillar strategy to deliver
on its ambitious vision
Building a scalable platform
Growing our fashion community
Bolstering the sustainability ecosystem
Our Vision
Our Strategy
“ We’re on a mission to
transform the fashion
industry for a more
sustainable future by
empowering our community
to drive the change ”
Tech first & asset light Attractive unit economics
Global & uniquely engaged Trust as a core value
BCorp & Climate positive Resale as a Service

5
Vestiaire Collective has become a leading online luxury
fashion resale platform with global operations
Notes:
1
Data for Vestiaire Collective platform. Annualized GMV representing the monthly GMV multiplied by 12.
Business model repositioning with renewed focus on technology (app-first,
e-commerce best practices) and operational excellence
Introduction of complementary Direct Shipping model (in 2019) resulting
increased engagement and reach and significant reduction in costs per order
Strong tailwinds from growing awareness towards sustainability and the role
of the circular economy
Accelerated international expansion across Europe, the US (acquisition of US
competitor Tradesy in 2022) and Asia
Passionate founding team including complementary fashion and technology
backgrounds
Seamless experience with fashion and trust positioned as key pillars of the
business model (all transactions physically authenticated)
Brand building and new customer acquisition mainly achieved organically,
through social networks, influencers and public relations
Progressive international roll-out in Europe (UK in 2012), the US (in 2014)
and Asia (in 2017)
2009 2018 2019
Annual GMV (€m)
1
CEO Change
2009 2010 2011 2012 2013 2014 2015 2016 2017 2018
<1
3
11
18
30
52
89
130
171
197
Annualized GMV (€m)
1
Jan-19 Jan-20 Jan-21 Jan-22 Jan-23
33% p.a. growth
Dec-23
192
285
485
685
817
957
857

6
Vestiaire Collective at a glance: a leading global marketplace
for pre-loved luxury fashion
640
Full-time employees
2024
Aims at reaching breakeven
towards the end of 2024. Already
profitable (gross margin) across
every price range
€824m
Gross Merchandise Value
achieved in 2023
33%
Through-the-cycle Gross
Merchandise Value CAGR (5-year)
70+
Countries of presence
4.8m
Available items across all
fashion categories

7
Strong operational team dedicated to deliver long-term
profitable growth
Fanny Moizant
Co-Founder & President
Founded Vestiaire Collective in 2009
Maximilian Bittner
Chief Executive Officer
Joined Vestiaire Collective in 2018
Charles Bellois
Chief Experience &
Logistics Officer
Joined VC in 2018
Chief Financial Officer
Joined VC in 2021
Bernard Osta
Chief Operating Officer
Joined VC in 2021
Klemen Drole
Chief Strategy Officer
Joined VC in 2019
Thomas Hezard
CEO North America
Joined VC in 2023
Samina Virk
Chief Impact Officer
Joined VC in 2020
Dounia Wone
Chief Technology Officer
Joined VC in 2022
Olaf Zschiedrich
Sophie Hersan
Co-founder & Fashion
Director
Founded VC in 2009
Chief Marketing Officer
Joined VC in 2023
Marie-Christin Oebel
Chief Product Officer
Joined VC in 2023
Adam Kwiecinski

8
Management
Vestiaire Collective is backed by high profile long-term
shareholders perfectly matching its global ambitions
Luxury Sustainability
Europe Growth US Growth APAC Growth
Founders, managers and other Condé Nast
Kering
1
Generation IM
2
Eurazeo
Vitruvian
Bpifrance
Luxury Tech Fund
Ventech
Balderton
Other funds
Tiger Global Management
1
John Doerr
3
Other funds
3
SoftBank
2
Korelya
4
22.5%
9.6%
5.8%
2.5%
2.2%
1.8%
1.1%
3.8%
3.6%
0.8%
6.0%
2.8%
2.8%6.9%
4.5%
23.2%
Notes: Shareholding as of Dec 31, 2023, on a fully-diluted basis.
1
Co-led the €178m fundraising announced in March 2021;
2
Co-led the €178m fundraising announced in September 2021;
3
Former shareholders of Tradesy;
4
Paris-based
investment group funded by Korea-based technology company Naver

2
Market overview

10
€76bn
€220bn
€290bn
€345bn
€550bn
1998 2002 20182000 2021 2030E20031996 1997 20201999 2001 2004 2005 2006 2007 2008 2009 2010 2011 2012 20172013 20192014 2015 2016 2022
A large, resilient and growing personal luxury goods market
Notes:
1
Bain/Altagamma personal luxury goods report (June 2023 update)
• The personal luxury goods market amounted to €345bn in 2022
• The industry has grown at a CAGR of 6% in the past 25 years and is expected to maintain the same pace until 2030
Global personal luxury goods market
1
+6% p.a.
+6% p.a.

11
The breakthrough of online luxury fashion resale
Notes:
1
BCG report: “What an Accelerating Secondhand Market Means for Fashion Brands and Retailers” (October 2022);
2
Source: ThredUp resale report (2023 edition)
• The broad fashion resale market is expected to deliver annual growth of 15% over 2022-2027E
• … and a sustained 21% annual growth for the online fashion resale market in which Vestiaire Collective operates
177
211
248
288
324
351
2024E2022 20272025E2023E 2026E
Global fashion resale marketsize
2
(in $bn)
+15% CAGR
Key drivers of secondhand
purchase in luxury fashion
1
1
2
3
4
Affordability and value
Variety of choice
Sustainability
Thrill of the hunt
50%
40%
40%
35%
(% approval rate among interviewed shoppers)

12
Vestiaire Collective has secured an attractive positioning in the
fashion marketplace ecosystem
High End: €350+ AOV
Mass: €50- AOV
Consignment and
purchase models
Asset-light
marketplaces
Presence in: Europe US Asia
Attractive unit economics
thanks to:
✓High average order value
✓Low costs per order

3
Brand positioning

14
Vestiaire Collective’s commitment to luxury fashion
translates into attractive catalog and GMV mix
Scope: Based on 2023 data
• Vestiaire Collective is primarily exposed to timeless brands from leading luxury houses (c.75% of its GMV) and therefore
insulated from risks associated to (i) mono-brand businesses or (ii) less-established fashion brands
40% New-ins
75% GMV
14% New-ins
13% GMV
17% New-ins
7% GMV
17% New-ins
3% GMV
Luxury houses
Designers
Premium
Middle Brands
Other
12% New-ins
2% GMV

15
Vestiaire Collective delivers impactful and innovative branding
campaigns, effectively leveraging its brand pillars
Puppets campaign
March to May 2022: Branding
campaign run in France & Italy
+7pp aided brand awareness
+11pp aided brand awareness
Stylist campaign
September and October
2023: Branding campaign run
in the US, France, Germany,
Italy leveraging our
community to build trust &
fashion authority
Burberry x Vestiaire Collective
October 2023: Announcing our
Resale as a Service partnership with
Burberry, positioning VC as the
trusted resale partner for luxury
brands
Think First, Buy Second(Hand)
November 2023: Wave II of Vestiaire
Collective’s fast fashion ban
212M+ PR clippings reach
18M+ Organic social videos views

4
Business model

17
A business model reflecting the four pillars of Vestiaire
Collective’s mission
Asset-light dual business model dedicated to promote trust with consumers
Supply-driven model confirming the high desirability of the luxury fashion category
Global platform dedicated to grow the share of more sustainable local-to-local transactions
Technology-led to offer a superior customer experience to our community of users
1
2
3
4

18
Vestiaire Collective has developed an innovative, asset-light
and scalable dual business model
Notes:
1
Based on 2023 data
Direct
Shipping
Advanced
Authentication
Product
online &
sold
Item
deposit
Item
shipped to
buyer
Item
shipped to
buyer
Digital
authen-
tication
VC-led process
Seller-led process
Reach a larger share of customers’
wardrobe and drive engagement
• Option for buyers to opt-out of physical control for
selected transactions
• Offer reduced shipping time and greater
affordability as well as more sustainable shopping
Create strong brand DNA building
on customer trust
• Self-listing and selling, with physical control by
Vestiaire Collective once the sale is initiated
• 4 authentication centers located in France, the
UK, the US and HK
~2/3 of
GMV
~1/3 of
items sold
~1/3 of
GMV
~2/3 of
items sold
Physical
control
Sources of supply
1
C2C: 81%
B2C: 18%
VIP / RaaS: 1%
1

19
Vestiaire Collective operates a supply-driven business
highlighting the high desirability of its underlying market
• The high correlation between new listings and items sold is reinforcing the high relevance of our asset-light peer-to-peer
business model generating no inventory (i.e., supply drives growth but not inventory)
• Since Q4 2023, we have secured on average c.30k new-in items per day (that represents 9x more than the average
observed in 2018 of c.3.5k new-in items per day)
Jan-
18
Jan-
19
Jan-
20
Jan-
21
Jan-
22
Jan-
23
Dec-
23
Items sold
New-in items
One-off: migration
of Tradesy catalog
2

20
Vestiaire Collective has built a true global marketplace,
dedicated to grow its share of local-to-local transactions
Notes: Data for Vestiaire Collective from January to December 2023. DAT stands for Germany and Austria, ROE for the Rest of Europe and ROW for Rest of the World
• Vestiaire Collective has become a true global player with customers (buyers and sellers) located on three continents
• Local-to-local transactions (i.e., regional within Europe, the Americas and APAC) represent close to 80% of our GMV
• With the acquisition of Tradesy, the share of local-to-local transactions in the Americas has significantly increased. Still,
the highly attractive supply from Europe remains a key differentiating factor to win in this strategic market
GMV %
FRANCE DAT UK ITALY ROE AMERICAS APAC ROW
Total
FRANCE
4,9% 3,6% 0,6% 2,1% 5,9% 1,8% 0,7% 0,3% 19,8%
DAT
1,7% 2,0% 0,2% 0,7% 2,8% 0,9% 0,3% 0,1% 8,7%
UK
0,4% 0,3% 7,0% 0,2% 0,8% 1,8% 0,6% 0,2% 11,3%
ITALY
3,3% 3,4% 0,6% 3,2% 5,8% 2,2% 0,7% 0,3% 19,5%
ROE
4,3% 4,1% 0,7% 2,2% 7,9% 2,5% 0,9% 0,4% 23,0%
AMERICAS
0,3% 0,2% 0,3% 0,1% 0,5% 7,3% 0,6% 0,3% 9,7%
APAC
0,2% 0,2% 0,3% 0,1% 0,4% 1,4% 2,4% 0,3% 5,3%
ROW
0,2% 0,2% 0,2% 0,1% 0,4% 1,1% 0,4% 0,1% 2,7%
Total
15,3% 14,0% 9,8% 8,6% 24,6% 18,9% 6,6% 2,1% 100%
… To (Buyer Country)
From… (Seller Country)
3

21
Jan-
19
Jan-
20
Jan-
21
Jan-
22
Jan-
23
Dec-
23
104
151
264
345
359
415
55%
91%
Monthly average 2018 Monthly average 2023
+36pp
4x since January 2019
Logged Daily Average User [in k]Share of logged daily traffic through app
With technology unlocking consumer engagement, Vestiaire
Collective is building a unique community of fashion lovers
• The app first strategy initiated in 2019 has driven strong growth in traffic data
• Product features introduced in recent years are allowing consumers to engage with the platform in many ways, at any
time and from anywhere
4

5
Business performance

23
214
192
285
485
685
820
957
857
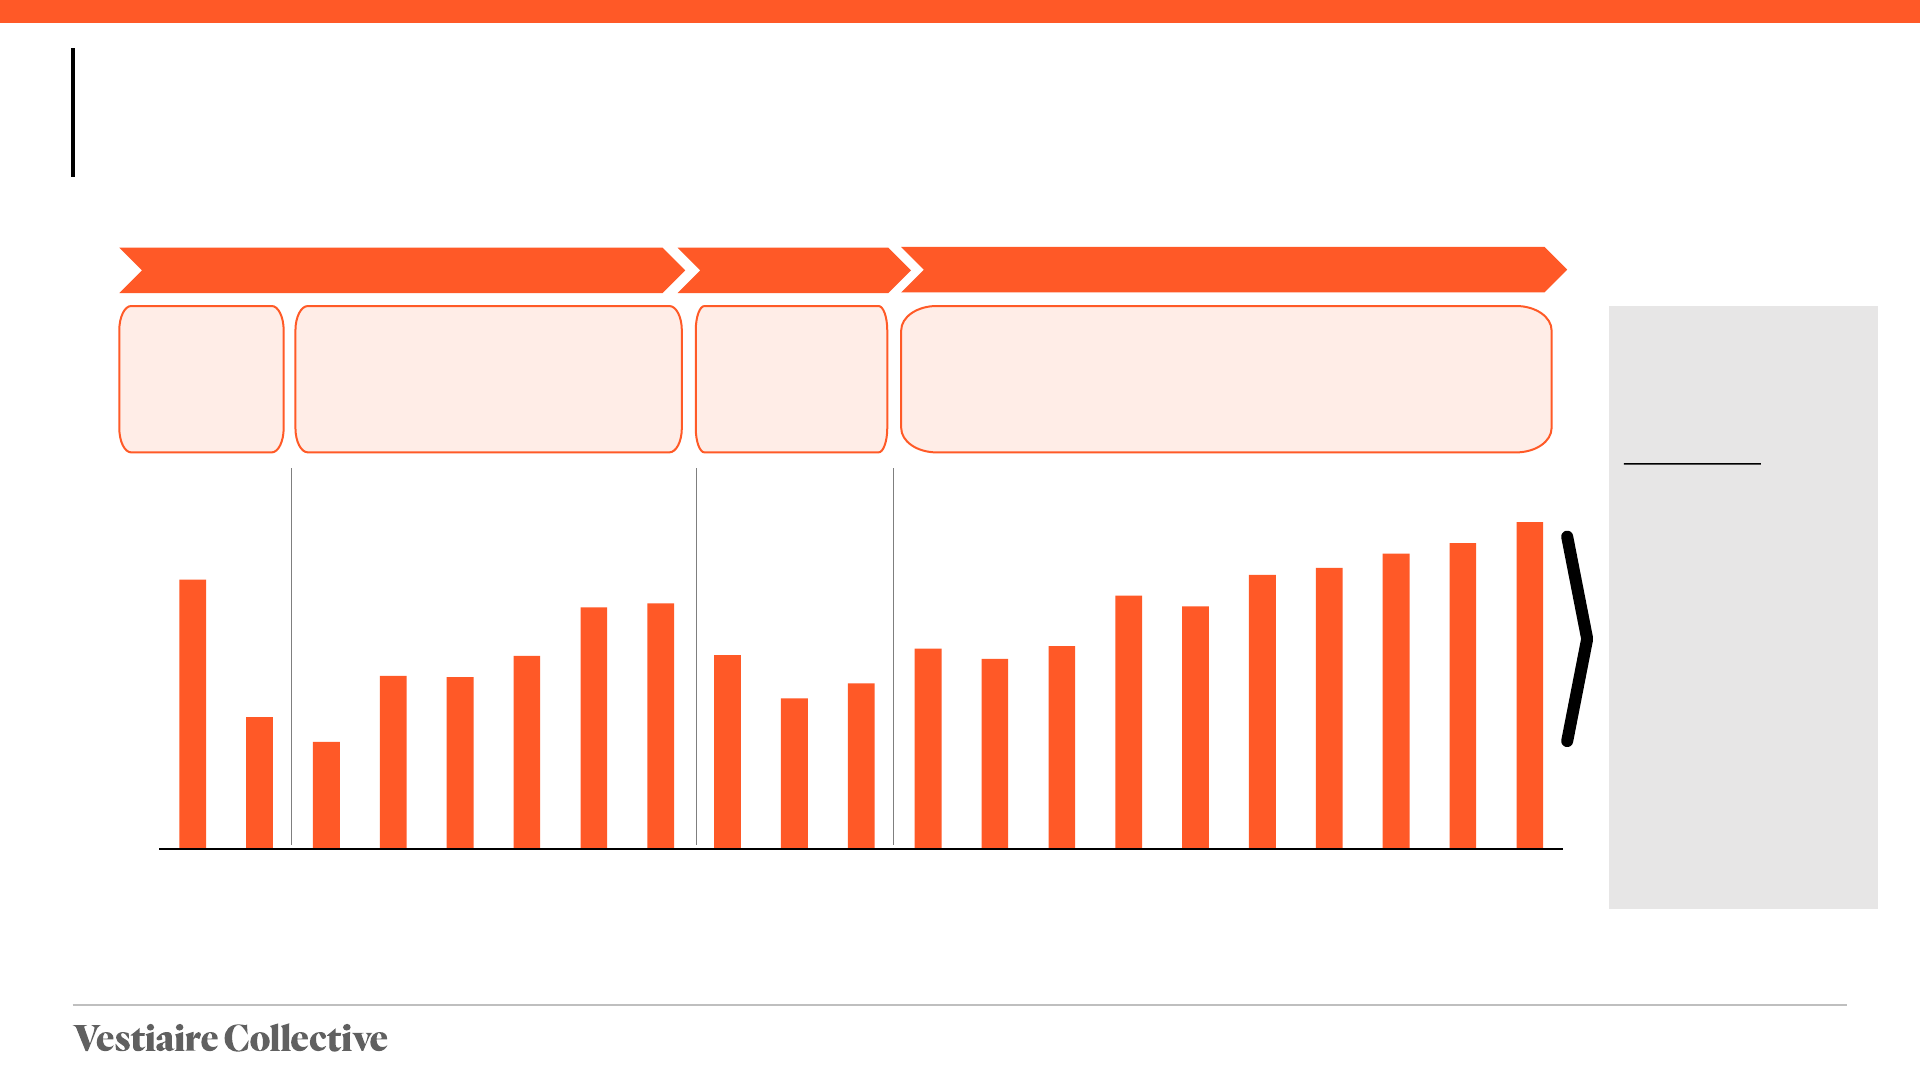
Sustainable growth since 2019 driven by increased focus on
technology and well-executed strategic initiatives
Annualized GMV for
Vestiaire Collective
platform only (€m)
Max Bittner
appointed CEO
• New vision & team
• App-first strategy
• Launch of Direct
Shipping
• Rollout of Direct Shipping
• US and APAC expansion
• Technology
improvements
• US and APAC
consolidation
• Development of local-
to-local strategy
• New commission
structure
Jan-18
Jan-20
Jan-21 Jan-22
Jan-19
Jan-23
• Acquisition of Tradesy
• Brand relaunch
• Progressive increase in
commissions
• US-first strategy
• Personalization
• RaaS acceleration
Dec-23
2019
2020
2021
2022
2023

24
19
30
52
102
168
173
156
121
167
256
348
386
464
417
Each of our three main regions are delivering sustained GMV
growth
International
AmericasCore Europe (FR, UK, DAT, IT)
53
89
177
236
266
320
284
Jan-20 Jan-21 Jan-22Jan-19 Jan-23 Dec-23 Jan-20 Jan-21 Jan-22Jan-19 Jan-23 Dec-23 Jan-20 Jan-21 Jan-22Jan-19 Jan-23 Dec-23
c.30% p.a. growth c.55% p.a. growth c.40% p.a. growth
Annualized GMV (€m)
25
Vestiaire Collective has been primarily managed for growth until
Q4 2021. Significant profitability gains recorded since then
Q2
19
Q3
19
Q4
19
Q1
20
Q2
20
Q3
20
Q4
20
Q1
21
Q2
21
Q3
21
Q4
21
Q1
22
Q2
22
Q3
22
Q4
22
Q1
23
Q2
23
Q3
23
Q4
23
7.7%
3.8%
3.1%
4.9%
4.9%
5.5%
6.9%
7.0%
5.5%
4.3%
4.7%
5.7%
Q1
19
5.8%
7.2%
6.9%
7.8%
5.4%
8.4%
8.7%
Jan
24
9.3%
8.0%
PC2
margin
(% of
NMV)
Reduction in
commissions
to drive growth
Significant reduction in costs per order
mainly coming from the introduction of
the Direct Shipping model
More challenging
e-commerce
environment
2024 Target: > 10%
Main drivers:
• Continue focusing
on monetization
• Continue reducing
cancellation rate
• Continue reducing
costs per order as
Vestiaire Collective
scales up
• Continue increasing
contribution from
higher AOV region
(Americas)
Significant profitability gains from more dynamic management of
commissions, growing focus on reducing cancellation rate and
progressive reduction in transportation costs
Business Reset Post-Covid
Continuous Improvement

26
Financial performance, 2018A-2024E Revenue build-up
Consolidated P&L Observations
• Orders have been multiplied by 5 over the past 5
years (38% CAGR) to reach 2.3m in 2023
• We operate with a high AOV of c.€350 reflecting our
luxury positioning
• GMV has been multiplied by 4 since 2018 (33%
CAGR) to reach €824m in 2023 (and a run rate of
€957m in Nov-2023)
• We have reduced our cancelled transaction value
(CTV) rate over the past two years taking it from 21.0-
21.5% over 2019-2021 to 20.6% in 2022 and 19.5%
in 2023
• Revenue reached €157m in 2023, up by 24% YoY on
VC platform. It reflects a take rate of 24%
• In 2024, we expect to grow our GMV and NMV by
18% and our Revenue by 24%. Considering our
historical track record, we are confident in our ability to
achieve those objectives
18A-23A 18A-24E
FYE 31-12, €m
FY18A FY19A FY20A FY21A FY22A FY23A FY24E CAGR CAGR
Orders 472 078 634 733 1 296 456 1 823 131 2 236 586 2 337 670 2 762 614 38% 34%
% YoY Growth 8,5% 34,5% 104,3% 40,6% 22,7% 4,5% 18,2%
Orders VC Platform only 472 078 634 733 1 296 456 1 823 131 2 089 576 2 337 670 2 762 614 38% 34%
% YoY Growth 8,5% 34,5% 104,3% 40,6% 14,6% 11,9% 18,2%
AOV (€) 417 380 297 289 356 352 353
GMV 197 241 385 526 796 824 975 33% 31%
% YoY Growth 14,7% 22,3% 59,6% 36,8% 51,2% 3,5% 18,4%
GMV VC Platform only 197 241 385 526 720 824 975 33% 31%
% YoY Growth 14,7% 22,3% 59,6% 36,8% 36,9% 14,4% 18,4%
NMV 157 190 302 414 626 663 785 33% 31%
% CTV 20,3% 21,2% 21,4% 21,3% 21,4% 19,5% 19,5%
% YoY Growth 13,5% 20,8% 59,1% 37,0% 51,1% 6,1% 18,4%
NMV VC Platform only 157 190 302 414 572 663 785 33% 31%
% CTV 20,3% 21,2% 21,4% 21,3% 20,6% 19,5% 19,5%
% YoY Growth 13,5% 20,8% 59,1% 37,0% 38,1% 16,0% 18,4%
Revenue 43 48 71 94 135 157 194 30% 29%
% of NMV 27,2% 25,3% 23,5% 22,6% 21,6% 23,6% 24,7%
% YoY Growth 17,8% 12,4% 47,4% 32,0% 44,6% 15,9% 23,8%
Revenue VC Platform only 43 48 71 94 125 157 194 30% 29%
% YoY Growth 17,8% 12,4% 47,4% 32,0% 34,0% 25,0% 23,8%

27
Financial performance, 2018A-2024E P&L statement
Consolidated P&L Observations
• Revenue reached €157m in 2023, up by 24% YoY on
VC platform. It reflects a take rate of 24%
• PC2 (Gross Profit) reached €55m in 2023, up by 38%
vs. 2022. It reflects a PC2/NMV margin of 8.3% and a
PC2/Revenue margin (i.e., gross margin) of 35.0%
• PC3 (contribution before central costs) reached €13m
in 2023, from negative results in 2021 and 2022,
notably reflecting increased marketing efficiency
• Opex (operational expense) decreased from €114m in
2022 to €89m in 2023, reflecting notably the
successful integration of Tradesy (the company we
acquired in the US in April 2022)
• Our EBITDA burn decreased significantly in 2023,
from -€117m in 2022 to -€76 in 2023. In particular, our
monthly EBITDA burn in Dec-2023 stood at -€4m
• Through continuous improvement (growth and
improvement of our unit economics), we aim at
reducing our EBITDA burn to -€31m in 2024. In
particular, our monthly EBITDA burn in Dec-2024 is
expected to be lower than -€1m
18A-23A 18A-24E
FYE 31-12, €m
FY18A FY19A FY20A FY21A FY22A FY23A FY24E CAGR CAGR
Revenue 43 48 71 94 135 157 194 30% 29%
% of NMV 27,2% 25,3% 23,5% 22,6% 21,6% 23,6% 24,7%
% YoY Growth 17,8% 12,4% 47,4% 32,0% 44,6% 15,9% 23,8%
Revenue VC Platform only 43 48 71 94 125 157 194 30% 29%
% YoY Growth 17,8% 12,4% 47,4% 32,0% 34,0% 25,0% 23,8%
Retail COGS -3 -3 -4 -5 -10 -13 -11
PC1 40 45 67 88 126 144 183 29% 29%
% of NMV 25,6% 23,8% 22,1% 21,3% 20,1% 21,6% 23,3%
Marketplace COGS -26 -36 -48 -67 -86 -89 -101
CPO COGS (€) -55,1 -57,3 -37,1 -36,8 -38,3 -38,0 -36,7
PC2 (Gross Profit) 14 9 19 21 40 55 82 31% 34%
% of NMV 9,1% 4,7% 6,2% 5,1% 6,4% 8,3% 10,4%
% of Revenue 33,3% 18,4% 26,5% 22,6% 29,4% 35,0% 42,0%
Marketing -11 -7 -10 -29 -43 -42 -36
CAC (€) -102 -49 -43 -85 -90 -87 -66
% of NMV -6,9% -3,5% -3,5% -7,0% -6,8% -6,3% -4,6%
PC3 3 2 8 -8 -3 13 45 31% 54%
% of NMV 2,1% 1,2% 2,7% -1,9% -0,5% 2,0% 5,8%
Opex -25 -36 -45 -63 -114 -89 -77
% of NMV -15,9% -18,9% -14,8% -15,3% -18,2% -13,4% -9,8%
EBITDA -22 -34 -36 -71 -117 -76 -31 -- --
% of NMV -13,7% -17,8% -12,0% -17,2% -18,7% -11,4% -4,0%
% of Revenue -50,5% -70,2% -51,2% -75,9% -86,3% -48,3% -16,2%

28
Glossary
• AOV Average order value
• CAC Customer acquisition cost
• CPO Costs per order
• CTV Cancelled transaction value
• GMV Gross merchandise value
• NMV Net merchandise value
• PC1 Profit contribution 1 (= revenues less retail COGS)
• PC2 Profit contribution 2 (= revenues less retail & marketplace COGS = gross profit)
• PC3 Profit contribution 3 (= gross profit less marketing = EBITDA before opex)
• RaaS Resale as a Service
