
This lesson plan was originally developed by the Global Health Education and Learning Incubator at Harvard University in 2018. It is used and
distributed with permission by the Global Health Education and Learning Incubator at Harvard University. The Incubator’s educational materials are
not intended to serve as endorsements or sources of primary data, and do not necessarily reflect the views of Harvard University.
This resource is licensed Creative Commons Attribution-Non Commercial-NoDerivs4.0Unported
gheli@harvard.edu
617-495-8222
Social Determinants in Data and Pictures
Lesson Plan 2
2018
Purpose
In this lesson, students compare living conditions across a variety of populations through the use of pictures
provided by the interactive web resource “Dollar Street” and using data from the International Human
Development Indicators. They then relate this glimpse into ordinary people’s lives to national-level data on
health and social determinants.
This is one of four lesson plans in a teaching pack on “Social Determinants of Health.” Other lessons in this
teaching pack include:
• “Comparing and Applying Frameworks”
• “When Words Break Bones, Without Sticks and Stones”
• “Social Status”
Each of the lessons may be taught independently, or sequentially as a complementary module. Additional
companion materials in the pack include an instructor’s note, a teaching guide titled “Brief Introduction to
the Social Determinants of Health,” an annotated bibliography, and a glossary of terms.
Learner Level
• High School, Undergraduate
Time
One 1-hour session
Required Materials
• Access to: Dollar Street. Gapminder. https://www.gapminder.org/dollar-street.
• Access to: International Human Development Indicators. United Nations Development Programme
2022. http://hdr.undp.org/en/countries.
• Copies of the Handout accompanying this lesson.
Resource Summary
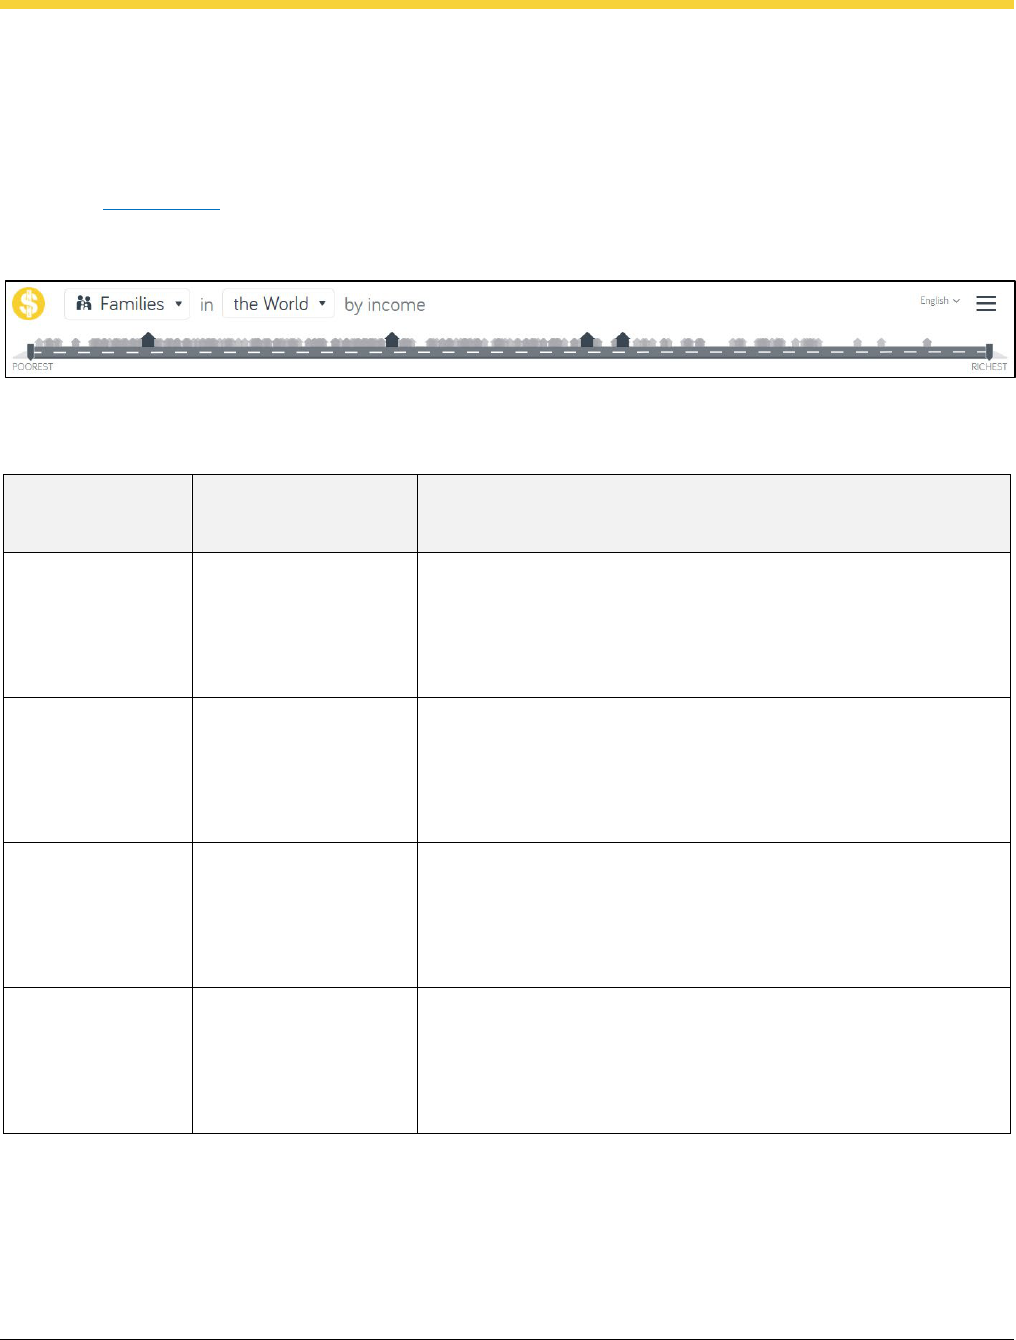
Activities for this lesson are centered on two interactive data tools. The Gapminder “Dollar Street” portal
imagines that everyone in the world is living on one street, “Dollar Street,” lined up from lowest to highest
income. As users interact with the data, they see the various aspects of the lives of each household living on
that street. Many of the images—photographs of families and their household objects, taken in real homes
across the world—give insights into the social determinants impacting health on Dollar Street, and allow for

Lesson Plan: Social Determinants in Data and Pictures
2
This resource is licensed Creative Commons Attribution-Non Commercial-NoDerivs4.0Unported
gheli@harvard.edu
617-495-8222
easy comparison of conditions across different populations. This tool is a user-friendly, hands-on tool that
introduces students with computer and internet access to the social determinants of health interactively.
The second tool used in this lesson was produced by the United Nations Development Programme to
illustrate human development data by country. The data interactive and country profiles include data related
to health, education, income, inequality, gender, poverty, employment, and many more indicators for each
country. This tool is provided to give students a resource to find country-specific data.
Learning Goals
1. To explore the social and material conditions in which people around the world live, using the
interactive “Dollar Street” tool.
2. To use population-level data to compare social and health conditions across countries and
understand the links between social determinants and health.
Procedure
Part 1: Getting Acquainted
(30 Minutes)
1. Have students begin with “Dollar Street,” the first resource listed above. The default setting should
be Families in the World by income. If not, change the view to this setting using the dropdown
menus. Within any particular row, there should be four images of families, organized left to right,
from poorest to richest. Students should create a table like those below for all of the entries in a
single row of “Dollar Street.” An example of a filled-out table is provided below. The handout that
accompanies this lesson contains a blank table for students to fill in with their findings. Ideally each
student or group of students will select different countries within “Dollar Street” so that they can
compare differences with each other later on in the lesson.
Table 1 - Observations from Dollar Street
Country Monthly Income (U.S. Dollars) Observations from Photos
Latvia $11,318 Spacious living room with nice furnishings, nice
clothing, white walls of high quality
Russia $578 Nice clothing, slightly worn walls
Thailand $179 Cheaper furnishings than Latvian example, lots of
plants, decent clothes
Burundi $27 Mud walls, dirty and ill-fitting clothing
2. Students can then click on each case in the row they selected above and write down any additional
observations they have about each family. More information is available by first clicking on the tile
representing the family and then clicking on “Visit this home.”
3. After viewing photos and recording data/observations in the steps above, students should then go
to the International Human Development Indicators, the second resource used in this lesson.
Students should open the country profiles for two of the countries represented in their “Dollar

Lesson Plan: Social Determinants in Data and Pictures
3
This resource is licensed Creative Commons Attribution-Non Commercial-NoDerivs4.0Unported
gheli@harvard.edu
617-495-8222
Street” table. For each of the two countries, they should write down the following items and put
them into a table:
o Health Life Expectancy
o Gender Maternal mortality ratio
o Demography Dependency ratio, young age
o Education Expected years of schooling
o Two other items of interest (same for both countries)
The handout accompanying this lesson contains an empty table for students to fill out. Below is an
example of how the completed table might appear if the student selected Burundi and Latvia:
Table 2 – Health indicators for Burundi and Latvia
Country
(name)
Life
Expectancy
(years)
Maternal
Mortality
Rate (per
100,000)
Dependence
Ratio
Expected
Years of
Schooling
(years)
Indicator of
Your Choice
Indicator of
Your Choice
Burundi 57.1 712 85.0 10.6 4.9 77.7
Latvia 74.3 18 22.7 16.0 79.2 1.4
Part 2: In-Class or Group Discussion
(30 Minutes)
For the rest of class, the instructor will build on the information students gathered in Part 1, leading an open-
ended group discussion about the social determinants of health, and focusing on the questions provided
below:
1. Describe the differences in social or infrastructural conditions between the richer and poorer
families that were apparent from the pictures on “Dollar Street.”
Students may point out the differences in housing materials, foods in the home, clothing and visible
health of the family members, facilities in the home, etc. All of these observations give us clues about
the family’s social situation and how these social or infrastructural aspects of each family could
influence their health.
2. Which differences stand out the most to you when you compare the data you looked up in the
International Human Development Indicators profiles?
Encourage students to identify similarities among underdeveloped countries (e.g., they all have
lower life expectancy, less average education, etc.) and developed countries (higher life expectancy
and lower education). It is important to remind students that life expectancy and maternal mortality
ratio are health outcomes and education is a social factor that can cause health outcomes to be
better or worse.
3. Take a moment to think back about the countries whose International Human Development
Indicators you researched earlier, then rank them from highest to lowest life expectancy. What
factors do you think contribute to this trend across these countries?
Students’ responses should reflect an analysis of the social factors influencing health, and instructors
should encourage them to think about potential health levers in society (e.g. factors that can be

Lesson Plan: Social Determinants in Data and Pictures
4
This resource is licensed Creative Commons Attribution-Non Commercial-NoDerivs4.0Unported
gheli@harvard.edu
617-495-8222
leveraged to promote health in the given country), and potential sources of risk (e.g. factors
associated with worse outcomes, like poverty or low levels of education). Students should be
encouraged to consider the potential pathways by which these factors may impact health in ways
that lead to shorter or longer life expectancies.
Summary
In this lesson, students used multiple types of data to understand the social determinants of health and how
they can impact the health of populations and individuals. First, students used the “Dollar Street” tool to
become acquainted with different living situations and populations around the world. This involved using
information from pictures and numerical data to understand the underlying conditions for health. Next,
students looked through the data in the International Human Development Indicators to understand how
national-level statistics can help us understand the development levels and social conditions in given
populations. They considered how these social conditions in turn lay the groundwork for a social gradient in
health. Finally, students participated in an open-ended discussion to come together and interpret the data
they had gathered and examined. This synthesis process is important in encouraging students to look once
more at the connections between conditions for health (social determinants) and resulting health
conditions.
Lesson Plan: Social Determinants in Data and Pictures
5
This resource is licensed Creative Commons Attribution-Non Commercial-NoDerivs4.0Unported
gheli@harvard.edu
617-495-8222
Handout A
Social Determinants in Data and Pictures
Exploring Countries from “Dollar Street”
Online at “Dollar Street,” go to Families in the World by income. In the first drop-down, make sure Families is
selected. In the second one, make sure the World is displayed (you may need to click on Show all countries
and then Ok in order to achieve this).
Fi
ll out the table below based on the countries that you see in one row.
Table 1 – Observations from Dollar Street
Country Monthly Income
(U.S. Dollars)
Observations from Photos

Lesson Plan: Social Determinants in Data and Pictures
6
This resource is licensed Creative Commons Attribution-Non Commercial-NoDerivs4.0Unported
gheli@harvard.edu
617-495-8222
Pulling Data on International Human Development Indicators
In the International Human Development Indicators data tool, look up the following six characteristics for
two countries you looked at in Dollar Street, and complete the table below:
o Health Life Expectancy
o Gender Maternal mortality ratio
o Demography Dependency ratio, young age
o Education Expected years of schooling
o Two other items of interest (same for both countries)
Table 3 – Health indicators for two countries
Country
(name)
Life
Expectancy
(years)
Maternal
Mortality Rate
(per 100,000)
Dependence
Ratio
Expected
Years of
Schooling
(years)
Indicator of
Your Choice
Indicator of
Your Choice
