
1
ISC CENSUS AND ANNUAL REPORT 2023
ISC SCHOOLS: LOCATION, TYPE, STRUCTURE AND SIZE
PUPIL NUMBERS
REGIONAL DIFFERENCES
SINGLE-SEX AND CO-EDUCATION
BOARDING
MOVEMENTS BETWEEN SECTORS
SEND
ETHNICITY
INTERNATIONAL FOOTPRINT: NON-BRITISH PUPILS AND OVERSEAS CAMPUSES
SCHOOL FEES
BURSARIES AND SCHOLARSHIPS
PUBLIC BENEFIT
TEACHING STAFF
UNIVERSITY ENTRANCE
EXAM RESULTS
ECONOMIC IMPACT

2
This report is based on a survey carried out in January 2023. All 1,395 schools in UK membership
of the constituent associations of ISC (“ISC schools”) completed the survey.
Appendix One gives a snapshot of ISC schools as they were in January 2023. Appendix Two shows
comparative figures for the schools that completed the Census in both 2022 and 2023 and is
therefore the best guide for annual change.
ISC’s constituent associations are: the Association of Governing Bodies of Independent Schools
(AGBIS), the Girls’ Schools Association (GSA), the Heads’ Conference (HMC), the Independent
Association of Prep Schools (IAPS), the Independent Schools Association (ISA), the Independent
Schools’ Bursars Association (ISBA) and the Society of Heads (SofH).
Four associations are affiliate members of ISC: the Council of British International Schools (COBIS),
the Boarding Schools’ Association (BSA), the Scottish Council of Independent Schools (SCIS) and
the Welsh Independent Schools Council (WISC).
The ISC Research and Data Team would like to thank all participating schools
for the considerable time taken to complete the Census and to check returns,
particularly during the busy start of the spring term and when other Census
completions are required.
ISC Research and Data Team
Jonathan Parkes (Head of Research and Data)
Shun-Kai Chan
Shun-Yue Chan
Danny Chan
Design and layout: Tom Forge [email protected]
www.DesignForge.ink
Printing: Lazervision Ltd, Kent, TN8 6EL

Fig 1 School location and pupil density 6
Fig 2 ISC school membership 7
Fig 3 ISC school structures 8
Fig 4 Average school size by type of school 9
Fig 5 Size of school 9
Fig 6 ISC pupil numbers since 1990 10
(selected years)
Fig 7 Annual growth in pupil numbers 10
split by region (like-for-like)
Fig 8 Girls as a percentage of all pupils 11
Fig 9 Proportion of year groups that 11
are entirely boys, entirely girls,
or are co-educational
Fig 10 Boarders at ISC schools: 2000-2023 12
Fig 11 Boarders as a percentage of all pupils 12
Fig 12 Boarders as a percentage of all pupils 13
in each region
Fig 13 Full, weekly and exi boarding 13
by year group
Fig 14 New pupils breakdown 14
Fig 15 SEND pupils 14
Fig 16 Ethnicity of ISC pupils (2023) 15
Fig 17 Ethnicity comparisons for schools 15
in England: Number of pupils
and % share (2022)
Fig 18 Ethnicity of ISC pupils by region (2023) 15
Fig 19 Non-British pupils at ISC schools 16
Fig 20 Origin of non-British pupils 17
at ISC schools
Fig 21 Number of non-British pupils whose 18
parents live overseas from selected
countries at ISC schools: 2007-2023
Fig 22 Location of overseas campuses 18
of ISC schools
Fig 23 Overseas schools in membership 18
of ISC associations
Fig 24 School fees (excluding nursery fees) 19
Fig 25 Fee increases since 2000 (like-for-like) 19
Fig 26 Contributions to fees ranked by 20
total value of assistance (annual)
Fig 27 Proportion of pupils receiving 20
fee assistance: 2000-2023
Fig 28 Distribution of means-tested bursaries 21
and means-tested scholarships
Fig 29 Trends in means-tested bursaries and 21
scholarships versus non-means-tested
scholarships at ISC schools (2011-2023)
Fig 30 Breakdown of facilities at ISC schools 22
Fig 31 Number of state schools and 22
state pupils beneting from
partnership activities
Fig 32 Partnerships with local state schools 23
Fig 33 Teacher numbers and pupil-teacher ratio 24
Fig 34 Teaching assistant numbers 24
Fig 35 Higher Education destination summary 25
Fig 36 Destination of ISC pupils attending 26
UK universities: Top 25
Fig 37 Destination of ISC pupils going to 26
non-UK universities: Countries
Fig 38 Destination of ISC pupils attending 26
non-UK universities: Top 10
Fig 39 A-level entries as a proportion 27
of all entries
Fig 40 Proportion A*/A (A-level) grades 28
in England
Fig 41 The impact of independent schools 29
on the UK economy
Appendix One: Non-Comparative Tables 30
Table 1 School and pupil numbers by 30
category of school
Table 2 Pupil numbers by age 30
Table 3 Pupil numbers by year group 31
Table 4 New pupil numbers by year group 31
Table 5 Pupil numbers by region 32
Table 6 Fees by region (including nursery fees) 32
Table 7 Fees by age group 33
(including nursery fees)
Table 8a Contributions to fees: senior, mixed-age 33
and junior schools (termly values)
Table 8b Contributions to fees: single-sex and 33
co-educational schools (termly values)
Table 8c Contributions to fees: day and 34
boarding schools (termly values)
Table 9 Non-British pupils whose parents 34
live overseas
Table 10 Non-British pupils whose parents 35
live in the UK
Table 11 New non-British pupils whose 36
parents live overseas
Table 12 New non-British pupils whose 37
parents live in the UK
Table 13 British pupils with parents 37
living overseas
Table 14 Destination of post-18 school leavers 38
Table 15 Destination of pupils going to 38
non-UK universities
Table 16 Size of schools 39
Table 17 Boarders as a percentage of all pupils 40
Table 18 Boys as a percentage of all pupils 40
Table 19 Teacher numbers 41
Table 20 Teaching assistant numbers 41
Table 21 Pupil-teacher ratios 41
Table 22 Changes to full-time teachers 42
Table 23 SEND pupils 42
Appendix Two: Comparative Tables 43
Table 1 Changes to pupil numbers 43
by category of school
Table 2 Changes to pupil numbers by age 44
Table 3 Changes to pupil numbers 45
by year group
Table 4 Changes to new pupil numbers 46
by year group
Table 5 Changes to pupil numbers by region 47
Table 6 Changes to fees by region 48
Table 7 Changes to fees by school type 48
and age group
Table 8a Changes to contributions to fees: 49
senior, mixed-age and junior
schools (termly values)
Table 8b Changes to contributions to fees: 50
single-sex and co-educational
schools (termly values)
Table 8c Changes to contributions to fees: 51
day and boarding schools
(termly values)
Table 9 Changes to non-British pupils 52
whose parents live overseas
Table 10 Changes to non-British pupils 53
whose parents live in the UK
Table 11 Changes to British pupils 54
whose parents living overseas
Table 12 Changes to teacher numbers 54
Table 13 Changes to teaching assistant numbers 55
Table 14 Changes to pupil-teacher ratios 55
Table 15 Changes to full-time teachers 56
Appendix Three: ISC Regions IBC
Fig 1 ISC English Regions IBC
CONTENTS
Foreword 2
Executive Summary 4
ISC Schools 6
Location 6
Type 7
Structure 8
Size 9
Pupil Numbers 10
By Region 10
Single-sex and Co-education 11
Boarders 12
Movement Between Sectors 14
SEND 14
Ethnicity 15
International Footprint 16
Non-British Pupils 16
Overseas Schools 18
School Fees 19
Scholarships and Bursaries 20
Public Benet 22
Teaching Sta 24
Entrance to Higher Education 25
Exam Results 27
Economic Impact 29

2
Foreword
What does an independent school in the UK look like in 2023? The range is diverse
and much more varied than most people realise. Many independent schools are
small and serve working parents who seek the best t for their child.
Our schools are adaptable and the sta are hardworking, serving a growing
number of pupils, and it is thanks to the professionalism and dedicated eort
and care of committed sta that we see high academic and pastoral standards and
increasing philanthropic work from independent schools.
This year independent schools are facing many headwinds following the Covid
pandemic, with economic uncertainty, rising costs and priorities such as good
mental health and wellbeing, inclusion and sustainability.
But this has not dimmed their commitment to their core charitable purpose,
this year illustrated by the fact that there are over 2,000 Ukrainian pupils in
independent schools across the UK, many of whom are funded by schools
themselves. These students add to the proud tradition within our sector of pupils
culturally enriching their schools and local communities with their own experience.
And fee assistance provided by ISC schools has again increased, breaking the
billion-pound barrier for the rst time. Almost 30% of pupils receive some form of
fee assistance through the school, and the average value of a bursary has also increased
to £11,800. There is a trend towards more high-value bursaries: an increasing
number of pupils receive a transformative bursary worth 75% or more of fees.
Collaborative partnerships between state and independent schools rose by a
quarter this year, as this activity recovers from the disruption caused by Covid
restrictions. These projects take many forms, including sharing teaching resource,
supporting pupils with university entry and cultural enrichment through sport,
music and drama.
Almost a fth of pupils – over 100,000 – receive some form of SEND support
according to the Census, with families often choosing independent schools
because of the smaller class sizes or the specialist support they provide. This
year also saw a 29% increase in the number of pupils with an Educational
Health and Care Plan, a real testament to the trusted range of SEND support
available within our schools.

3
Our schools are often smaller than people might expect: of the 1,395 schools
that completed the Census, almost 60% (809 schools) have fewer than 350 pupils.
The median size school is just 291 pupils. By age range our largest group is junior
schools (639 schools), whose mean size is 235 pupils.
In a signicant development, state school pupils now comprise the largest
group of new entrants into the sector (almost 30%, more than from each of the
other sources of new entrants – other independent schools, nursery schools
and overseas). Like-for-like pupil numbers have increased by 1.6%; this is patchy
across year groups, with the largest increases in GCSE years (Years 10 and 11).
This Census covers only ISC schools. If one looks at all independent schools in
the UK, pupil numbers have fallen over the course of the past ve years.
Independent schools are also key contributors to the national and their local
economy through employing sta and buying goods and services from local
businesses. Research from Oxford Economics highlighted in the Census shows
that, as a whole, independent schools in the UK contribute £16.5 billion to the
economy, supporting 328,000 jobs and £5.1 billion in tax revenue. They save the
taxpayer £4.4 billion every year by providing for hundreds of thousands of pupils
who would otherwise be competing for state school places, often in the most
oversubscribed areas of the country.
Independent schools in 2023 are intrinsic to the education system, providing
educational and community opportunities and ensuring that there is increased
capacity and specialism in UK education. But we are keen to do more: ISC would
welcome conversations with all those involved in education about how to best
share resource and knowledge in the sector to support the mission of raising
educational standards for all children in 2024 and beyond.
Barnaby Lenon, Chairman
Independent Schools Council

4
Executive Summary
1. THE INDEPENDENT SCHOOLS SECTOR CONTINUES TO GROW STEADILY
• There are now 554,243 pupils at 1,395 ISC member schools, up from 544,316 in 2022.
• At the 1,360 schools completing the Census in both 2022 and 2023, pupil numbers
have increased by 1.6%.
• Every UK region experienced an increase in independent school pupil numbers,
with the largest growth of 2.2% recorded in the South East region.
• 110,211 of the pupils are new to their school in the current academic year, an
increase from 109,795 in 2022.
• Most ISC schools are small – half of schools have under 290 pupils and one quarter
of schools have under 155 pupils. Only 7% of ISC schools have 1,000 pupils or more.
• Nearly 4 out of 10 pupils in ISC schools are from a minority ethnic background.
The proportion of pupils who are from a UK minority ethnic background continues
to increase, showing that ISC schools reect the overall diversity of the UK school
population. In 2022, 37.7% of pupils identied as UK minority ethnic, whereas in
2023, the proportion has risen to 39.6%.
• 103,337 pupils identied as having SEND, equating to 18.6% of all pupils, an
increase from last year.
• 61,803 non-British pupils attend ISC schools this year, comprising 11.2%
of all ISC pupils.
• 2,073 pupils in ISC schools are from Ukraine. 786 of these pupils have both parents
remaining in Ukraine, and 1,104 are new to ISC schools this academic year.
2. MEASURED FEE INCREASES IN AN INFLATIONARY ECONOMIC ENVIRONMENT AND
INCREASING FEE ASSISTANCE
• ISC schools are continuing to control fee increases, with an annual average increase
of 5.6%. This is similar to government gures of wage ination, meaning fees have
grown only slightly in real terms.
• The average day school fee has increased by 5.8%, with the majority of day schools
charging between £3,000 and £5,500 per term.
• Fee assistance worth over £1.2bn was provided this year, an increase of 5.9%.
• For the rst time, fee assistance worth more than £1bn originated directly from
the school, of which £494m was provided on a means-tested basis.
• Over a third of all ISC pupils receive some type of fee assistance.
• The average means-tested bursary was worth £11,807 per annum, an increase
of 8.9% compared with last year, showing a continuing trend in schools to
support more disadvantaged families in accessing high-quality education.
• 9,620 pupils paid no fees at all, an increase of 23% from last year.

5
3. STEADY GROWTH IN THE NUMBER OF BOARDING PUPILS
• There were 66,325 pupils boarding on the day of the Census – 19th January 2023.
This represents 12.0% of all pupils in ISC schools and an increase of 1,093 boarders
compared with 2022.
• If we consider pupils registered to board at any point during the academic year
2022/23, there were 70,123 boarders.
4. ISC SCHOOLS ARE INCREASING THEIR STATE SCHOOL PARTNERSHIP ACTIVITIES
• ISC schools reported 8,793 partnerships in the calendar year 2022, an increase of 26%
from last year. These activities include helping sixth form pupils from state schools
apply to university, sharing facilities, serving as a state school governor, and seconding
teaching sta to state schools.
• 1,043 ISC schools reported operating at least one partnership with a local state school,
an increase from 936 last year.
• Beyond partnerships with state schools, between £9.4m and £14.9m was raised
for charities at ISC schools this year and 885 ISC schools organised volunteering
opportunities for their sta and / or pupils.
5. MOST SIXTH FORM LEAVERS FROM ISC SCHOOLS GO ON TO HIGHLY RANKED UNIVERSITIES
• 92% of Year 13 ISC pupils continue to higher education in the UK or overseas.
• 50% of ISC pupils who enter UK higher education attend one of the “Top 25” group
of universities as dened by The Sunday Times Good University Guide.
• 4% of pupils entering UK higher education attend either Oxford or Cambridge.
• 6% of pupils who enter higher education choose to attend an overseas university.
Universities in the USA are the most popular, attracting 54% of this set of pupils. Last
year, pupils went on to 553 dierent overseas universities in 48 dierent countries.
6. UK INDEPENDENT SCHOOLS ARE INCREASING THEIR INTERNATIONAL PRESENCE
• ISC schools operate 107 campuses overseas, educating over 71,500 pupils. This is an
increase from 93 campuses and nearly 60,000 pupils in 2022.
• There are 25,469 non-British pupils at ISC schools whose parents live overseas, an
increase of 1.6% on 2022. Pupils from Hong Kong and mainland China comprise
the largest groups with 5,654 and 4,706 pupils respectively.
• 36,334 non-British pupils have one or both parents living in the UK. The number
of Hong Kong pupils in this category continues to increase, with 2,357 pupils in
ISC schools compared with 1,538 last year – an increase of 53.3%. Given the
change in government policy permitting Hong Kong British Nationals (Overseas)
to resettle in the UK, this is not a surprising nding.
• This year, 645 teachers from outside the UK came to teach in ISC schools.

6
Fig 1. School location and pupil density
Map 1 relates to ISC schools only and covers all of the UK (ISC data 2023). Map 2 illustrates pupil density
1
for all independent schools, but is con ned to England
and Wales only (DfE and Welsh Government data 2022). Map 3 shows a detailed breakdown of pupil density
1
in London.
ISC Schools: Location, School Type, Structure and Size
Map 2. This map shows the pupil density
1
in England
and Wales broken down by local authority. Equivalent
gures are not available for other parts of the UK.
Map 3. A detailed breakdown of pupil density
1
in London.
1
Proportion of school-age children that are educated independently.
Map 1. ISC schools in all of the UK (ISC data 2023).

7
Fig 2. ISC school membership
This page illustrates the number of schools in ISC membership by school type. We have categorised the schools by their pupils’ age,
gender and whether they have day or boarding pupils. Each school is counted in one (and only one) category for each type. There is
also a note at the bottom of this page explaining changes in membership between 2022 and 2023.
Fig 2. ISC school membership
This page illustrates the number of schools in ISC membership by school type. We have categorised the schools by their
pupils’ age, gender and whether they have day or boarding pupils. Each school is counted in one (and only one) category
for each type. There is also a note at the bottom of this page explaining changes in membership between 2022 and 2023.
639
Junior
schools
261
Senior
schools
495
Mixed-age
schools
1,130
Co-ed
schools
159
Girls’
schools
106
Boys’
schools
961
Day
schools
434
Boarding
schools
Gender
1,130 Co-ed schools
Schools that do not fall into either the category of
boys’ or girls’ schools
159 Girls’ schools
Schools with no boys in year groups above nursery
106 Boys’ schools
Schools with no girls in year groups above nursery
Day/Boarding
961 Day schools
Schools that have no boarders
434 Schools with boarders
Schools that have at least one boarding pupil
Age
261 Senior schools
Schools where all pupils are in Year 7 and above
495 Mixed-age schools
All other schools with mixed age ranges
639 Junior schools
Schools where all pupils are in Year 8 and below
Changing Membership
Since last year’s Census, where 1,388 schools were in membership of the constituent associations: 21 schools left, 32 schools joined,
9 schools consolidated records with other ISC member schools to form 4 schools, and 1 school split to form 2 schools for Census
reporting. There are therefore 1,395 schools in membership this year, 1,362 of which participated in both the 2022 and 2023 Census.
2 schools who did the Census in both years are not included in this number due to a change in their structure. The gures from only
these 1,360 schools make up the tables in Appendix Two for an accurate comparison of the sector.
1,395
total number of schools
Nursery
Nursery
Nursery
Year 13
Year 13
Year 13
Year 7
Year 8

Fig 3. ISC school structures
Figure 2 illustrates the numbers of ISC schools according to whether they are senior,
mixed-age or junior. ISC schools cover a range of dierent year groups, sometimes
making categorisation dicult. For completeness, Figure 3 shows the most common
sets of year group ranges found within ISC schools. The blue bars show year group
structure for each subcategory. The numbers in white indicate the number of schools
that share that particular year group structure.
1
Senior schools are dened as having all pupils in year 7 and above.
2
Mixed-age schools are dened as all other ISC schools.
3
Junior schools are dened as having all pupils in year 8 or below.
4
Some school structures are excluded from this illustration because their structure
is shared by fewer than 10 schools: 127 schools are excluded – 17 senior schools, 73
mixed-age schools and 37 junior schools.
ISC Schools: Location, School Type, Structure and Size
The 1,395 schools in ISC membership can be categorised in
several ways – location, age range, gender, day/boarding,
and size. Examining these categories demonstrates the
considerable variety of schools found in the independent
schools sector.
Firstly, the maps in Figure 1 show the geographical spread
of ISC’s schools and the proportion of pupils educated in an
independent school by local authority. Map 1 shows that the
majority (53%) of ISC schools are located in the London, South
East, and South Central ISC regions, educating 50% of all ISC
pupils. Looking at all independent schools in England, 47% are
located in these regions, educating 54% of all independent
pupils. Map 2 illustrates that while local authorities with
higher proportions of pupils in independent education tend
to be found in these same regions, local authorities such as
Newcastle upon Tyne, Salford and Stockport also have at least
9% of pupils independently educated.
Figure 2 categorises ISC schools in three dierent ways – by
age range, by gender, and by day/boarding. It shows that
nearly half (46%) of schools are junior schools; over four in ve
(81%) are co-educational schools; and over two thirds (69%)
are day schools.
Figure 3 shows the most common school structures in terms
of the range of year groups for senior, mixed-age and junior
schools. While this diagram illustrates that many schools oer
education to a common range of year groups, the fact that
127 schools cannot be shown as their structure is shared by
fewer than 10 schools demonstrates that there is considerable
variation within the sector.
Senior
1
N/R Y1 Y2 Y3 Y4 Y5 Y6 Y7 Y8 Y9 Y10 Y11 Y12 Y13
148
50
22
13
11 11
Other senior schools: 17
4
Mixed-age
2
N/R Y1 Y2 Y3 Y4 Y5 Y6 Y7 Y8 Y9 Y10 Y11 Y12 Y13
283
71
37
20
11
Other mixed-age schools: 73
4
Junior
3
N/R Y1 Y2 Y3 Y4 Y5 Y6 Y7 Y8 Y9 Y10 Y11 Y12 Y13
377
196
19
7 10
Other junior schools: 37
4
8

9
Fig 4. Average school size by type of school
Fig 5. Size of school
Type of school Mean size Median size
Senior 483 464
Mixed 561 478
Junior 235 211
Day schools 354 240
School with boarding pupils 493 414
Co-ed schools 379 274
Single-sex schools 476 378
Overall 397 291
58
110
166
144
128
116
88
83
62
54
45
44
32
32
24
34
22
24
20
12
14
16
10
15
4
8
9
2
1
0
6
1
1
3
1
0
0
2
2
0
0
1
0
0
0
0
0
0
0
1
0
20
40
60
80
100
120
140
160
180
1 - 50
51 - 100
101 - 150
151 - 200
201 - 250
251 - 300
301 - 350
351 - 400
401 - 450
451 - 500
501 - 550
551 - 600
601 - 650
651 - 700
701 - 750
751 - 800
801 - 850
851 - 900
901 - 950
951 - 1000
1001 - 1050
1051 - 1100
1101 - 1150
1151 - 1200
1201 - 1250
1251 - 1300
1301 - 1350
1351 - 1400
1401 - 1450
1451 - 1500
1501 - 1550
1551 - 1600
1601 - 1650
1651 - 1700
1701 - 1750
1751 - 1800
1801 - 1850
1851 - 1900
1901 - 1950
1951 - 2000
2001 - 2050
2051 - 2100
2101 - 2150
2151 - 2200
2201 - 2250
2251 - 2300
2301 - 2350
2351 - 2400
2401 - 2450
2451 - 2500
Finally, Figures 4 and 5 show the range of sizes of schools
within the sector. Figure 4 shows that the mean school size is
397 and the median school size is 291. Breaking down school
size by category, junior schools are likely to be signicantly
smaller than senior and mixed-range schools, boarding
schools tend to be larger than day schools, and single-sex
schools are likely to be larger than co-educational schools.
Figure 5 illustrates that the majority of schools are small. One
quarter of schools have under 155 pupils, half of schools have
under 290 pupils, and three quarters of schools have under
535 pupils. Only 7% of schools have 1,000 pupils or more.
Number of schools
Number of pupils

10
Pupil Numbers: By Region
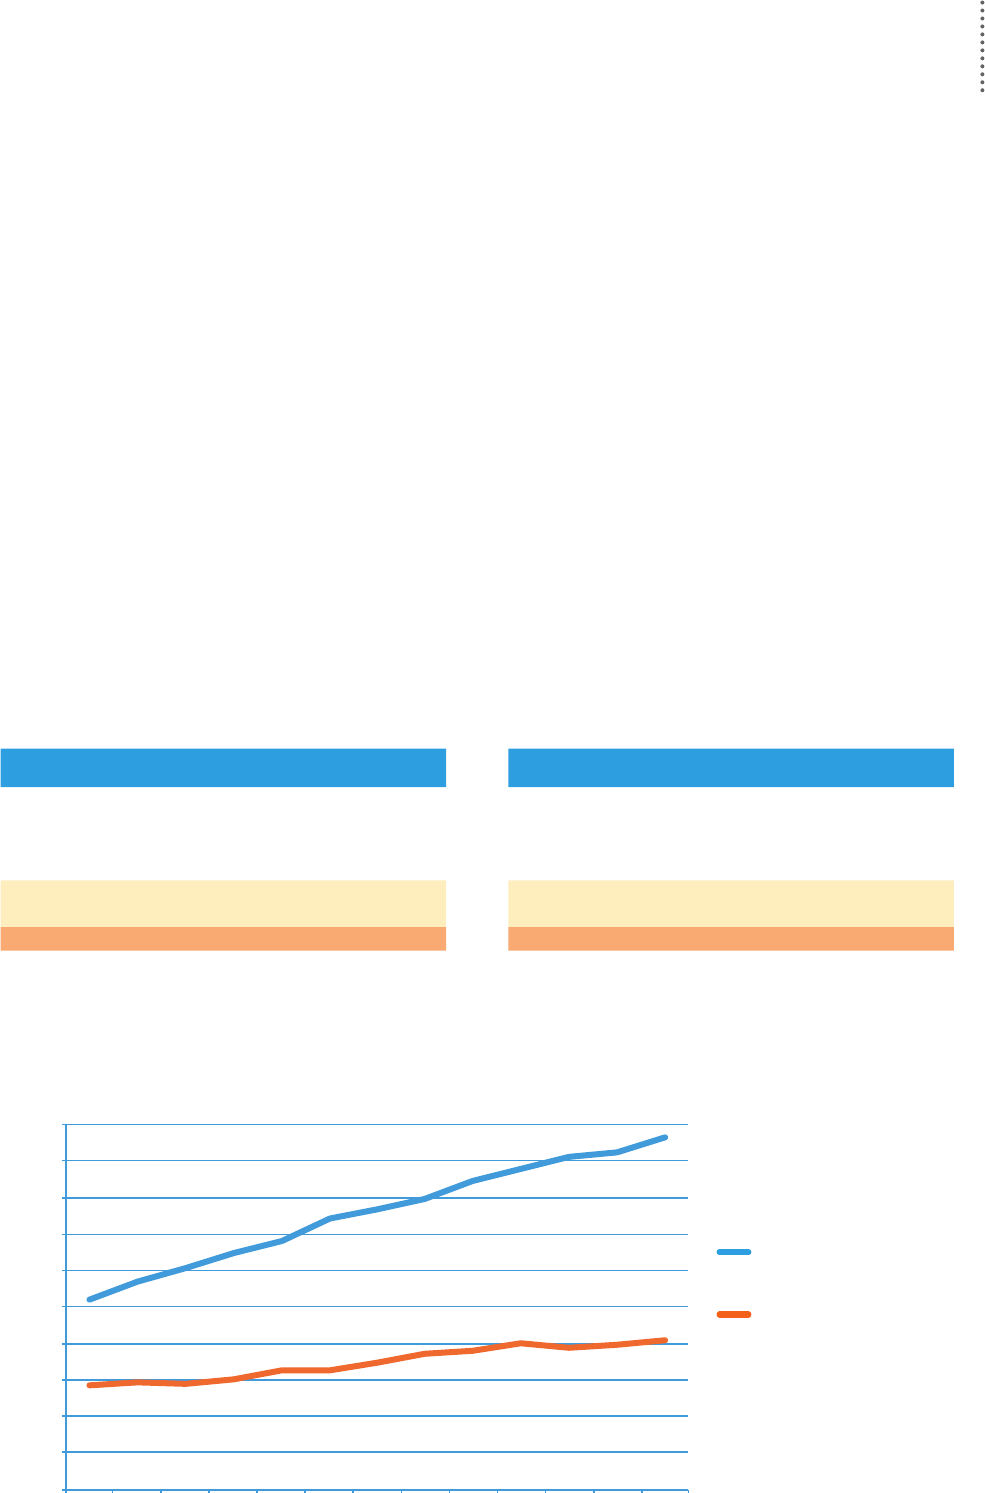
Pupil Numbers
There are now 554,243 pupils at ISC schools, up from 544,316 in
2022 as illustrated by Figure 6. If we consider only those schools
Whilst overall pupil numbers have grown nationally at ISC
schools, the rate of growth varies by region, as illustrated by
Figure 7. For example, pupil numbers in the South East have
risen 2.2%, whereas in Scotland the increase is only 0.4%.
It is important to note, however, that smaller regions (in
terms of prevalence of ISC schools) are more susceptible to
Fig 7. Annual growth in pupil numbers split by region (like-for-like)
uctuations in percentage change. For example, there are only
18 ISC schools in Wales and 17 schools in the North East that
completed the Census in both 2022 and 2023. Last year both
of these regions were among those with the highest growth in
pupil numbers – this year they are among the lowest.
in membership this year and last year, pupil numbers have
increased by 1.6% since 2022.
474,203
484,052
514,531
506,500
537,315
532,237
544,316
554,243
1990 2000 Pre-recession
high (2009)
Post-recession
low (2011) (2020)
2021 2022 2023
2.2%
2.0%
1.7%
1.6%
1.6%
1.4% 1.4%
1.3%
1.0%
0.8%
0.4%
0.3%
0.0%
0.5%
1.0%
1.5%
2.0%
2.5%
South
East
South
Central
South
West
East
Midlands
London North
West
East West
Midlands
North
East
Yorkshire &
Humber
Scotland Wales
Fig 6. ISC pupil numbers since 1990 (selected years)
Pre-Covid high

11
0
50
100
150
200
250
300
350
400
0
1 - 4
5 - 9
10 - 14
15 - 19
20 - 24
25 - 29
30 - 34
35 - 39
40 - 44
45 - 49
50 - 54
55 - 59
60 - 64
65 - 69
70 - 74
75 - 79
80 - 84
85 - 89
90 - 94
95 - 99
100
Pupil Numbers: Single-sex and Co-education
The majority of ISC schools are co-educational: only 17% are
single-sex in all year groups. A further 34 ISC schools are single-sex
but have a co-educational nursery. This accounts for over a third
of single-sex schools with a nursery. Therefore, the denition
of a single-sex school in this Census is a school which is single-
sex in all year groups above nursery. Using this denition, 19%
Figure 9 shows the proportion of single-sex schools compared
with co-education at each of the dierent year groups.
Co-education is very common at nursery level where 92%
of ISC schools have both boys and girls. As children get older,
single-sex education becomes more common, reaching a peak
Fig 9. Proportion of year groups that are entirely boys, entirely girls, or are co-educational
of schools are single-sex, educating 126,097 pupils collectively.
Further, Figure 8 illustrates that there are many other schools
that are predominately single-sex. Over 67% more girls are
educated in single-sex schools than boys. However, co-
educational schools have a higher proportion of boys, with
55% of pupils being male in these schools.
between years 7 and 10 where around 30% of ISC schools have
year groups of either all boys or all girls. Above Year 10, there is
a slight shift back to co-education. Finally, it is interesting to see
that from Year 10 there are more than twice as many schools
with single-sex girls’ year groups than single-sex boys’.
Number of schools catering for each year group
797 971 992 996 1,060 1,076 1,086 1,095 890 891 729 730 737 612 581
Single-sex boys’
schools
Single-sex girls’
schools
Fig 8. Girls as a percentage of all pupils
Number of schools
Percentage of girls
0%
10%
20%
30%
40%
50%
60%
70%
80%
90%
100%
Nursery
Reception
Year 1
Year 2
Year 3
Year 4
Year 5
Year 6
Year 7
Year 8
Year 9
Year 10
Year 11
Year 12
Year 13
Year group is co-educational
Year group is entirely girls
Year group is entirely boys
% schools

12
at any point during the academic year 2022/23 were 70,123,
an increase of 186 compared with 2022. Figure 10 shows the
number of boarders at ISC schools since 2000 and also the
percentage of all pupils that they accounted for.
Pupil Numbers: Boarders
Boarding numbers were 66,325 (based on the day the Census
was taken), making up 12.0% of total pupil numbers and an
increase on the 65,232 boarding pupils reported in 2022.
Boarding numbers based on pupils who boarded or will board
Figure 11 illustrates the proportions of boarding pupils at ISC
schools – 434 schools, representing 31% of all ISC schools, cater
for boarding pupils. Note, however, that in the large majority
Fig 11. Boarders as a percentage of all pupils
Percentage of boarders
0
1-4
5-9
10-14
15-19
20-24
25-29
30-34
35-39
40-44
45-49
50-54
55-59
60-64
65-69
70-74
75-79
80-84
85-89
90-94
95-99
100
Number of schools
(76%) of ISC boarding schools fewer than half of the pupils board.
Only 1.8% (or 8 schools) are exclusively boarding schools.
Fig 10. Boarders at ISC schools: 2000-2023
1
0
10
20
30
40
50
60
70
900
1000
800
700
1
2021 value shows estimated boarders as the Census was conducted during a period of remote learning due to Covid restrictions for most schools.
80
Boarders as a % of all pupils
Number of boarders on census night
0%
2%
4%
6%
8%
10%
12%
14%
16%
0
10,000
20,000
30,000
40,000
50,000
60,000
70,000
80,000
2000 2001 2002 2003 2004 2005 2006 2007 2008 2009 2010 2011 2012 2013 2014 2015 2016 2017 2018 2019 2020 2021 2022 2023
% pupils
Total number of boarders
Number of boarders on Census night Boarders as a % of all pupils

13
0% 10% 20% 30% 40% 50% 60% 70% 80% 90% 100%
Full boarding
Weekly boarding
Flexi boarding
Fig 12. Boarders as a percentage of all pupils in each region
Fig 13. Full, weekly and exi boarding by year group
Sixth form
Senior (excl. Sixth form)
Junior & below
Total
Day: 62,457
Boarding: 28,324
Day: 208,384
Boarding: 37,742
Day: 213,279
Boarding: 4,057
Day: 484,120
Boarding: 70,123
Figure 12 illustrates regional variations in boarding. At schools
located in the South Central region, 23% of pupils board, while at
schools in London, just 2% of pupils board.
Figure 13 illustrates boarding patterns for ISC schools as a whole
and by year group. While overall, 13% of pupils are registered
boarders, in sixth forms this proportion more than doubles
to over three in ten pupils. For junior pupils, this proportion is
signicantly lower, with only 2% of pupils boarding.
In addition to boarding being far more prevalent at sixth form
than at junior level, sixth form pupils are far more likely to
board on a full-time basis: 87% of sixth form boarding pupils
are full boarders, 8% are weekly boarders and 5% are exi
boarders. In contrast, more than half of junior boarding pupils
are exi boarders. Whilst full boarding remains most popular
overall, the pattern appears to be changing with weekly
and exi boarding becoming more popular. The proportion
of weekly and exi boarders has increased in recent years,
although it has reduced slightly from last year. In 2016, 15.7%
0% 10% 20% 30% 40% 50% 60% 70% 80% 90% 100%
Full boarding
Weekly boarding
Flexi boarding
0% 10% 20% 30% 40% 50% 60% 70% 80% 90% 100%
Full boarding
Weekly boarding
Flexi boarding
0% 10% 20% 30% 40% 50% 60% 70% 80% 90% 100%
Full boarding
Weekly boarding
Flexi boarding
Note: Northern Ireland, the Channel Islands and the Isle of Man are excluded due to the small
numbers of schools in these regions but are included in the total.
Note: For Figure 13, pupils are classed
as boarders if they boarded at some
point during the academic year
2022/23. In other tables and charts,
pupils are counted as a boarder if they
boarded on Census Day (19th January
2023). A larger number of boarders
are, therefore, included in Figure 13.
of boarders were weekly or exi boarders; last year the gure
was 22.8%, but this year the gure is 21.2%. Many working
parents value the exibility of weekly and exi boarding.
Region
Number
of ISC
schools
Number of
ISC schools
with one
or more
boarder
Total
number of
pupils
Total
number of
boarders
Boarders as
% of pupils
South Central 225 100 80,747 18,571 23.0%
South West 93 48 36,749 8,103 22.0%
Wales 18 9 7,409 1,266 17.1%
South East 195 85 79,805 13,135 16.5%
East Midlands 71 23 24,930 3,873 15.5%
West Midlands 103 31 36,997 4,712 12.7%
Yorkshire & Humber 63 24 26,474 2,735 10.3%
East 153 56 64,735 6,115 9.4%
Scotland 34 17 25,562 2,387 9.3%
North West 91 13 36,808 2,234 6.1%
North East 17 4 7,377 326 4.4%
London 313 19 114,964 2,446 2.1%
Total 1,395 434 554,243 66,325 12.0%

14
Fig 14. New pupils breakdown
Pupil Numbers: Movement Between Sectors
Approximately 6% of school children are educated at independent schools. Figure 14 illustrates where pupils were educated
before joining an ISC school this academic year. Nearly three in ten pupils new to the independent sector came from state-
funded establishments.
ISC schools provide SEND support for 103,337 pupils with SEND
(18.6% of all pupils). Of these, 87,698 pupils have been identied
with one or more specic SEND. This compares with 82,391 in
2022. 7,171 pupils have an Educational Health and Care (EHC)
Plan (6.9% of all ISC SEND pupils). The most common SEND
is Specic Learning Diculty (SpLD), which includes conditions
such as dyslexia and dyspraxia and represents 53.3% of all
SEND pupils in ISC schools.
Pupil Numbers: Special Educational Needs and Disabilities (SEND)
1
Fig 15. SEND pupils
1
SEND is also referred to as Additional Support Needs, particularly in Scotland.
State sector
29.8%
29.7%
21.0%
Independent sector
Nursery
(or not previously in education)
17.0%
Overseas
1.7%
Unknown
0.8%
Other
All new pupils
(110,211)
Types of SEND Total pupils % of all SEND pupils
Specic Learning Diculty (SpLD) 55,104 53.3%
Moderate Learning Diculty (MLD) 3,677 3.6%
Severe Learning Diculty (SLD) 236 0.2%
Profound & Multiple Learning Diculty (PMLD) 138 0.1%
Social, Emotional and Mental Health (SEMH) 17,919 17.3%
Speech, Language and Communication Needs (SLCN) 8,399 8.1%
Hearing Impairment (HI) 1,871 1.8%
Visual Impairment (VI) 1,900 1.8%
Multi-Sensory Impairment (MSI) 639 0.6%
Physical Diculty (PD) 2,568 2.5%
Autistic Spectrum Disorder (ASD) 9,997 9.7%
Other Diculty/Disability 5,344 5.2%
SEN support but no specialist assessment of type of need 15,639 15.1%
Total 103,337
Note: Some pupils have more than one SEND: they are counted under each individual category of SEND but are counted only once in the total.

15
0%
10%
20%
30%
40%
50%
60%
70%
80%
90%
100%
East East
Midlands
London North
East
North
West
South
Central
South
East
South
West
WalesW est
Midlands
Yorkshire
& Humber
sW
As in the UK as a whole, ethnicity in ISC schools varies by region
as shown by Figure 18. Finally, as with the trends experienced
among pupils in the state-funded sector, the proportion of
Fig 18. Ethnicity of ISC pupils by region (2023)
Note: some schools do not record ethnicity data; 85% of ISC schools were able to submit ethnicity data, equating to 72% of all ISC pupils. Last year we recorded
ethnicity for 71% of ISC pupils. Scotland is not included in the above chart because ethnicity was only known for 28% of pupils in Scotland.
pupils from a UK minority ethnic background at ISC schools has
increased in recent years; 23% of ISC pupils were identied as
UK minority ethnic in 2009
1
, compared with 40% now.
Figure 16 shows that 60.4% of all ISC pupils are from a White
British background, while 39.6% are from a UK minority ethnic
background. Figures for the state-funded sector only cover
schools in England and the latest data available are from 2022.
Fig 17. Ethnicity comparisons for schools in England: Number of
pupils and % share (2022)
Fig 16. Ethnicity of ISC pupils (2023)
Pupil Numbers: Ethnicity
In order to make a fair comparison, Figure 17 shows ethnicity
data for both ISC schools and state-funded schools in England
in 2022. This shows that the ethnic make-up at ISC schools
broadly mirrors that of all state schools.
ISC
schools % share
State-funded
schools % share
White British 225,914 61.5% 5,379,748 65.0%
UK minority ethnic 141,361 38.5% 2,901,894 35.0%
Total 367,275 8,281,642
No. of pupils % share
White British 240,119 60.4%
UK minority ethnic 157,542 39.6%
Total 397,661
UK minority
ethnic
White British
1
Ethnicity data was rst collected in 2009.

16
Fig 19. Non-British pupils at ISC schools
There are two categories of non-British pupils at ISC schools:
those whose parents live overseas and those whose parents
live in the UK. Figure 20 shows the relative number of pupils
at ISC schools from dierent overseas countries and regions.
For each country or region, it also shows the split between
those pupils who have parents living in the UK and those
whose parents live overseas.
International Footprint: Non-British Pupils
Figure 19 provides the numerical breakdown. In total, 59% of
non-British pupils have parents living in the UK.
For the rst time in 2023, data on pupils from Ukraine were
collected separately. A total of 2,073 pupils are attending ISC
schools, 38% of which have both parents overseas. 1,104 (53%)
of these pupils are new to ISC schools this academic year.
Total non-British
pupils
Parents
overseas
Parents
in UK
% with parents
overseas
% with parents in
the UK
Ireland 1,392 64 1,328 4.6% 95.4%
USA 4,829 354 4,475 7.3% 92.7%
Oceania 1,036 94 942 9.1% 90.9%
France 3,396 403 2,993 11.9% 88.1%
India 1,926 231 1,695 12.0% 88.0%
Pakistan, Sri Lanka & Bangladesh 519 75 444 14.5% 85.5%
Rest of North America 750 151 599 20.1% 79.9%
Poland 524 108 416 20.6% 79.4%
Italy 1,814 414 1,400 22.8% 77.2%
Remainder of Europe (EEA) 5,430 1,333 4,097 24.5% 75.5%
Romania 413 113 300 27.4% 72.6%
Middle East 1,867 604 1,263 32.4% 67.6%
Rest of Africa 1,884 658 1,226 34.9% 65.1%
Ukraine 2,073 786 1,287 37.9% 62.1%
Japan 1,119 477 642 42.6% 57.4%
South Korea 860 378 482 44.0% 56.0%
Remainder of Europe (non-EEA) 1,527 682 845 44.7% 55.3%
Central & South America 1,071 498 573 46.5% 53.5%
Russia 1,992 1,056 936 53.0% 47.0%
Spain 2,760 1,464 1,296 53.0% 47.0%
Mainland China 8,744 4,706 4,038 53.8% 46.2%
Nigeria 1,529 846 683 55.3% 44.7%
Central Asia 512 312 200 60.9% 39.1%
Malaysia 448 277 171 61.8% 38.2%
Germany 3,316 2,099 1,217 63.3% 36.7%
Hong Kong 8,011 5,654 2,357 70.6% 29.4%
Remainder of Far East 1,122 810 312 72.2% 27.8%
Taiwan 157 115 42 73.2% 26.8%
Thailand 782 707 75 90.4% 9.6%
Total 61,803 25,469 36,334 41.2% 58.8%

17
Fig 20. Origin of non-British pupils at ISC schools
In ISC schools, there are currently 25,469 non-British pupils whose
parents live overseas, which represents 4.6% of the total ISC pupil
population in 2023. In 2022, there were 25,079 such pupils, or
4.6% of all ISC pupils. If we exclude “international schools” (where
more than 90% of the pupils are from overseas), the number
drops to 4.4%. For the second consecutive year, the largest
number of overseas pupils come from Hong Kong.
Non-British pupils whose parents live overseas are more likely
to come to ISC schools in the sixth form and senior year groups
than junior year groups: 52% of such pupils are in years 12 and
13, 46% in years 7 to 11, with only 2% in years 6 and below. Not
surprisingly, these pupils are much more likely to board: 92% of
non-British pupils whose parents live overseas choose to board.
Figure 21 shows trends since 2007 (when the Census rst started
collecting these data) in non-British pupils whose parents live
International Footprint: Non-British pupils whose parents live overseas
overseas. European countries, with the exception of Russia, have
continued to rise. A total of 7,466 pupils come from European
countries, the largest number recorded during the period from
2007. The number of both Hong Kong and Mainland China pupils
with parents overseas has fallen. It should be noted that the total
number of pupils has risen from last year when pupils with one or
both parents in the UK are taken into account.
Since 2009, schools wishing to recruit pupils from overseas
have been required to hold a Student Visa (previously Tier 4)
sponsor licence issued by UK Visas and Immigration (UKVI).
With the exception of Ireland, any school recruiting overseas
pupils must be on UKVI’s register of licensed sponsors.Our
Census shows that 652 ISC schools are Student Visa sponsors.
Oceania
Central &
South America
Central Asia
India
Ireland
Japan
Malaysia
Middle
East
Remainder
of Europe
(EEA)
Remainder
of Europe
(non−EEA)
Remainder of
Far East
Rest of Africa
Rest of North
America
Russia
South Korea
USA
Mainland
China
Germany
Over 90% of pupils have
parents living overseas.
Over 90% of pupils have
parents living in the UK.
Non-British pupils whose
parents live in the UK.
Non-British pupils whose
parents live overseas.
Thailand
Italy
Nigeria
France
Hong
Kong
Pakistan,
Sri Lanka, Bangladesh
Thailand
Taiwan
Ireland
Ukraine
Romania
Poland
Spain
Oceania
Central &
South America
Central Asia
India
Japan
Malaysia
Middle
East
Remainder
of Europe
(EEA)
Remainder
of Europe
(non−EEA)
Remainder of
Far East
Rest of Africa
Rest of North
America
Russia
South Korea
USA
Mainland
China
Over 90% of pupils have
parents living overseas.
Over 90% of pupils have
parents living in the UK.
Non-British pupils whose
parents live in the UK.
Non-British pupils whose
parents live overseas.
Thailand
Nigeria
France
Kong
Pakistan,
Sri Lanka, Bangladesh
Thailand
Taiwan
Ireland
Ukraine
Romania
Poland
Spain

18
In ISC schools there are currently 36,334 non-British pupils whose
parents live in the UK, representing 6.6% of all pupils. In 2022 there
were 31,029, equating to 5.7% of all pupils. Among these pupils
13,047 come from EEA countries, comprising 2.4% of all pupils.
The next largest source of non-British pupils with parents in the
UK is the USA with 4,475 pupils. The number of pupils from both
Hong Kong and Mainland China in this category continue to grow.
Hong Kong pupil numbers have increased 53% to 2,357 and pupil
numbers from China have increased 29% to 4,038.
International Footprint: Non-British
pupils whose parents live in the UK
International Footprint:
Overseas Schools
A growing number of ISC schools are operating overseas
campuses. Figure 22 shows that there are currently 107 such
campuses educating a total of 71,660 pupils. This has increased
from 93 campuses and 59,739 pupils in 2022. Pupils in overseas
campuses are not included elsewhere in this Census.
Furthermore, there are approximately 112 ISC aliated schools,
i.e., overseas schools in membership of ISC associations. Figure
23 shows where these schools are located. Data from these
schools are not included elsewhere in this Census.
Overseas campuses of ISC schools are only a small part of the
landscape of UK-orientated schools
1
overseas. We estimate
there to be over 6,000 such schools worldwide.
Fig 22. Location of overseas campuses of ISC schools
Fig 23. Overseas schools in membership of ISC associations
Note: ISC does not perform a detailed audit of overseas schools. Therefore, it is
possible that some schools could be counted twice if the school is a member of
more than one association.
1
A school that oers a UK curriculum and/or UK examinations and the curriculum
is delivered wholly or partly in English (if English is not one of the country’s
ocial languages) or has an English-medium curriculum separate from the
country’s national curriculum (if English is one of the country’s ocial languages).
As well as non-British pupils, there are 4,570 British pupils at ISC
schools whose parents serve in HM Forces. In addition, there
are 3,442 other British pupils whose parents live overseas
(see Appendix One, Table 13, p37 for more details).
International Footprint: British pupils
whose parents live overseas
Fig 21. Number of non-British pupils whose parents live overseas from selected countries at ISC schools: 2007-2023
Hong Kong
Mainland China
Europe excl. Germany and Russia
Germany
Russia
0
1,000
2,000
3,000
4,000
5,000
6,000
7,000
8,000
9,000
2007 2008 2009 2010 2011 2012 2013 2014 2015 2016 2017 2018 2019 2020 2021 2022 2023
Location GSA HMC IAPS ISA SofH
Africa 0 4 12 1 3
Americas 1 6 2 1 1
Asia 0 11 6 1 0
Australasia 1 4 0 0 0
Europe 1 13 9 1 5
Middle East 1 9 17 0 2
Total 4 47 46 4 11
Location Schools Pupils
Mainland China 49 29,302
United Arab Emirates 10 12,084
Thailand 8 7,776
Hong Kong 5 3,318
Malaysia 5 1,956
Other Asia 5 842
Qatar 4 4,682
Singapore 4 4,486
Africa 4 1,590
Saudi Arabia 4 1,574
Europe 4 1,175
South Korea 2 2,155
Oman 2 680
Australia 1 40
Total 107 71,660
Number of pupils

19
1
Oce for National Statistics – Average weekly earnings.
2
Oce for National Statistics – Consumer price ination.
3
The gures for 2021 and 2022 are estimated.
School Fees
In this year’s Census, for the rst time since the Covid
lockdowns we are able to calculate the annual percentage
change in fees without having to use a methodology that
incorporated estimating the number of boarders on the
night of the Census. Looking at the fees of all schools who
completed the Census in both 2022 and 2023, the overall
average fee increase is 5.6% (excluding nursery fees). This fee
increase should be viewed in the context of a period when the
UK economy has experienced higher than normal ination.
Figures from the ONS show that annual wage ination
stands at 5.4%
1
and CPIH – the UK government’s key ination
measure – stands at 8.8%
2
for the same January to January
period. Taking these national indicators into account, this
year’s overall average fee rise represents a measured increase
in fees.
Fee levels by age group and fee type for UK pupils are displayed
in Figure 24. The majority of pupils attend day schools, meaning
the typical fee level is £5,552 per term or £16,656 per annum, a
rise of 5.8% on 2022.
Fig 24. School fees (excluding nursery fees)
Figures represent average weighted fees per term. Average fee
gures are based on fees at schools completing the Census in 2023;
percentage change is calculated from the change among 1,347
schools completing the Census in both 2022 and 2023.
Day school fees vary by region, with average termly fees of just
over £4,000 in the North West, rising to £6,676 per term for day
schools in London (see Table 6 of Appendix One, p32 for more
details). While the majority of day schools charge between
£3,000 and £5,500 per term, 65 schools charge under £2,000.
Fig 25. Fee increases since 2000 (like-for-like)
3
Age group Boarding fee
Day fee
(boarding
schools)
Day fee
(day schools)
Sixth Form £13,676 £8,134 £6,025
Senior £12,787 £7,620 £5,854
Junior £9,320 £5,816 £5,108
Overall £13,002 £7,297 £5,552
% change 5.2% 4.7% 5.8%
0%
1%
2%
3%
4%
5%
6%
7%
8%
9%
10%
2000 2001 2002 2003 2004 2005 2006 2007 2008 2009 2010 2011 2012 2013 2014 2015 2016 2017 2018 2019 2020 2021 2022 2023

20
Figure 27 shows that since 2000 there has been a general
upward trend of schools providing fee assistance to an
increasing number of pupils. Schools gave more than twice
as much assistance in the form of means-tested scholarships
Scholarships and Bursaries
Fig 26. Contributions to fees ranked by total value of assistance (annual)
Fig 27. Proportion of pupils receiving fee assistance: 2000-2023
and bursaries as they did non-means-tested scholarships.
The total value of means-tested scholarships and bursaries
was £483m, an increase of 4.1% on last year. Bursaries and
means-tested scholarships were awarded to 7% of pupils.
A total of 183,434 pupils currently receive help with their fees,
representing 33.8% of all pupils
5
; the value of this help totals
over £1.2bn, an increase of 5.9% on last year. A signicant
majority (80%) of total fee assistance is provided directly from
the schools themselves: ISC schools currently provide fee
assistance worth more than £1bn annually, an increase of
4.3% on the previous year. £494m of this fee assistance was
means-tested, meaning that 49% of all fee assistance from
schools falls in this category.
5
Excludes data for schools in Northern Ireland, the Channel Islands and the Isle of Man.
Total
(pupils)
4
Average help received
by a pupil (£) % of all pupils
Total
(value £m)
The school 159,762 6,293 28.8 1,005
The school: means-tested: means-tested bursaries 39,358 11,807 7.1 465
The school: means-tested: scholarships 2,134 8,384 0.4 18
The school: means-tested: eligible families
1
2,543 4,682 0.5 12
The school: non-means-tested: scholarships 60,697 3,375 11.0 205
The school: non-means-tested: eligible families
1
75,435 4,041 13.6 305
The school: itrust
2
62 20,188 0.0 1.25
Early Years Funding 22,596 2,826 4.1 64
Local Authorities
3
4,818 26,488 0.9 128
Government Music and Dance Scheme 1,552 22,433 0.3 35
All other sources 1,821 9,605 0.3 17
Total number of pupils helped 183,434 6,810 33.8 1,249
1
Includes HM Forces discounts, sta discounts, sibling discounts and clergy discounts.
2
itrust is an IAPS charity supporting low-income families and families with short-term nancial diculties.
3
Excludes data for schools in Northern Ireland, the Channel Islands and the Isle of Man.
4
Some pupils receive help from more than one source: they are counted under each category, but are counted only once in the total.
20%
22%
24%
26%
28%
30%
32%
34%
36%
2000
2001
2002
2003
2004
2005
2006
2007
2008
2009
2010
2011
2012
2013
2014
2015
2016
2017
2018
2019
2020
2021
2022
2023
% of pupils receiving help
from somewhere
% of pupils receiving help
from school
21
Fig 28. Distribution of means-tested bursaries and means-tested scholarships
1
Trends are only shown from 2011 onwards
due to changes in methods of data collection
relating to fee assistance. Note, due to the change
in methodology we should be cautious about
drawing too many conclusions in trend data
between 2015 and 2016.
Figure 28 shows a breakdown of the 39,358 means-tested
bursaries and the 2,134 means-tested scholarships provided by
ISC schools. Nearly half of all pupils on means-tested bursaries
have more than half of their fees remitted and 7,097 pay no fees
at all. In contrast, means-tested scholarships tend to be smaller
and over half are for less than 25% of fees. 279 pupils pay no
fees as they receive a 100% means-tested scholarship and a
further 2,244 pay no fees as a result of a combination of school
sources, e.g., a scholarship and means-tested bursary, meaning
a total of 9,620 pay no fees, either via a single school source or a
combination of school sources.
Note that schools were asked to provide data on greater than
100% bursaries and scholarships. These contribute to costs
additional to the basic fee (such as school uniform). 976 pupils
benet from these bursaries, an increase of 43% from last
year, and representing 2.4% of all means-tested bursaries and
scholarships. This demonstrates an increasing commitment
by ISC schools to providing transformational bursaries.
In recent years, there has been a shift from non-means-tested
scholarships to means-tested bursaries and scholarships,
as illustrated in Figure 29. The total value of means-tested
bursaries and scholarships provided by schools has
increased by over £220m since 2011, a rise of 85%;
the total value of non-means-tested scholarships has
risen by 45% over the same period.
Means-tested bursaries
and scholarships
Non-means-tested
scholarships
Fig 29. Trends in means-tested bursaries and scholarships versus non-means-tested
scholarships at ISC schools (2011-2023)
1
Size of means-tested
bursary
Number of
pupils
% of means-tested
bursary pupils
Size of means-tested
scholarship
Number of
pupils
% of means-tested
scholarship pupils
1-25% 8,730 22.2% 1-25% 1,336 62.6%
26-50% 11,515 29.3% 26-50% 311 14.6%
51-75% 6,449 16.4% 51-75% 109 5.1%
76-100% 12,664 32.2% 76-100% 378 17.7%
100% 6,200 15.8% 100% 200 9.4%
>100% 897 2.3% >100% 79 3.7%
Total 39,358 Total 2,134
Note: 76-100% category includes >100% means-tested bursaries and scholarships.
0
50
100
150
200
250
300
350
400
450
500
2011 2012 2013 2014 2015 2016 2017 2018 2019 2020 2021 2022 2023
Value in £m

22
Public Benefit
In last year’s Census, it was possible to report only in a
limited way on the number and type of partnerships ISC
member schools have with local state schools. This was
because schools are asked to report on their partnership
activities in the previous calendar year, meaning that
Covid restrictions were still affecting schools’ ability to run
partnership activities. In this year’s Census, which reports the
partnership activities for the calendar year 2022, a return to
more detailed reporting in this area is now possible.
Schools have increased their partnership activities from 6,963 last
year to 8,793 this year – an increase of 26%. Similarly, the number
of schools with at least one partnership with a local state school
has risen by 11% from 936 last year to 1,043 this year, meaning
three quarters of all ISC schools are involved in partnership
activities, despite only 70% of schools holding charitable status.
Figure 32 shows a summary of the variety of partnerships
undertaken by ISC schools. It shows that partnerships
include seconding staff to state schools, sharing facilities,
helping state sixth formers prepare their university
application, serving as a state school governor, and inviting
state pupils to participate in joint classes or events.
Figure 30 is a summary of the facilities available at ISC
schools. Whilst some ISC schools have multiple facilities,
many do not. Assuming all these were shared with state
schools, they would only serve a small fraction of the
28,132
1
state-funded schools in the UK.
Fig 30. Breakdown of facilities at ISC schools
Fig 31. Number of state schools and state pupils beneting
from partnership activities
1
Publicly funded mainstream schools taken from “Education and Training Statistics for
the United Kingdom”.
2
Upper estimate assumes the remainder schools (36%) raised funds in line with the
average of £11,042 per school.
Number of
ISC schools
% of
ISC schools
All-weather athletics track 74 5.3%
Astroturf 759 54.4%
Concert hall/theatre 782 56.1%
Dance studio(s) 503 36.1%
Fitness centre 500 35.8%
Rowing facilities 90 6.5%
Sports centre 555 39.8%
Sports eld(s) 914 65.5%
Squash court(s) 198 14.2%
Swimming pool 577 41.4%
Tennis court(s) 797 57.1%
Total 1,395
Number of state-funded schools beneting from partnership activities
Number of state schools
Number of
ISC schools
% of
ISC schools
1-10 729 69.9%
11-20 175 16.8%
21-30 54 5.2%
31-40 27 2.6%
41-50 20 1.9%
51+ 38 3.6%
Total 1,043
Number of state-funded pupils beneting from partnership activities
Number of state pupils
Number of
ISC schools
% of
ISC schools
20 or fewer 141 13.5%
21 to 50 142 13.6%
51 to 100 181 17.4%
101 to 200 181 17.4%
201 to 500 197 18.9%
501-1000 99 9.5%
1001-2000 55 5.3%
2001+ 47 4.5%
Total 1,043
The number of state-funded schools and state-funded pupils
beneting from partnership activities is summarised in Figure 31.
On average, each of the 1,043 schools work with approximately
11 state-funded schools and 374 state-funded pupils.
Finally, beyond partnership work, 97% of ISC schools reported
that they have raised money for charities over the last year. Not
all schools were able to report the amount raised, but for the
61% of schools that reported an amount, the total raised for
charity in the calendar year 2022 was £9.4m. We estimate that
the true amount could be as high as £14.9m
2
if we include the
36% of schools that didn’t report totals. In addition, 885 ISC
schools organise volunteering opportunities for their sta and /
or pupils, which involves 181,794 pupils.

23
Fig 32. Partnerships with local state schools
Number of schools with at least one of a partnership type
3
35
1
2
3
4
6
7
8
9
10
1
2
4
5
6
Host joint
drama events
Invite pupils to attend
drama classes or performances
Second
teaching
sta
Other
Share concert hall/theatre
Share dance studio
111
353
50
191
69
Drama
441
Music
453
1
2
3
5
6
8
9
Partner with state schools
for Combined Cadet Force
Academy partnership
(sponsorship or co-sponsorship
excluding via federation)
Partner for various art projects
such as hosting exhibitions, running
art classes (e.g. life drawing and pottery)
Partner for debating and
public speaking clubs/events
Partner for other
extracurricular activities
(e.g. chess clubs, socials and school trips)
Partner with schools to host
exams (e.g. music and drama exams)
Have members of sta serving
as governors at state schools
Other
70
21
161
4
191
182
171
627
116
1
2
3
4
Host joint musical events
Invite pupils to attend music
lessons or performances
Second teaching
sta
Other
352
94
78
1
2
Academic
730
Other
808
Sport
894
Invite pupils to attend lessons,
workshops or other
educational events
575
562
4
323
Share knowledge, skills,
expertise and experience
3
151
Second teaching sta
Work together to
improve the quality
of teaching and
learning for pupils
5
162
Help schools to
prepare A-level
students for entry
to higher education
7
94
Other
174
Share
classrooms
315
490
753
95
260
261
209
158
170
Invite pupils to attend
coaching sessions
Host joint sporting events
Play sporting xtures
with or against state schools
Second coaching
sta
5
88
Other
Share
swimming pool
Share sports elds
Share astroturf
Share sports
centre
Share other
sports facilities
(e.g. tennis courts)
1,043 schools
in partnership with
state schools
8,793 partnerships
224
227
Second pupils
to state
schools (e.g.
reading with
younger pupils)
3
45
Second pupils
to state schools
(e.g. drama coaching)
3
62
Second pupils
to state schools
(e.g. music coaching)
4
101
Second pupils
to state schools
(e.g. sports coaching)
9
331
Other
331
9
331
9
Participate in teacher training events
with local state school teachers

24
Fig 33. Teacher numbers and pupil-teacher ratio Fig 34. Teaching assistant numbers
A total of 59,190 full-time equivalent teachers are employed
at ISC schools. The teaching profession (across the education
sector as a whole) has a far greater proportion of female
teachers, but this imbalance is much less pronounced at ISC
schools. 37% of full-time equivalent teachers at ISC schools are
men. This compares with 26% in state-funded schools
1
.
A total of 11,017 full-time equivalent teaching assistants are
employed at ISC schools, making up 16% of classroom sta.
The equivalent proportion at state-funded schools is 37%,
over twice as high
1
. The pupil-teacher ratio at ISC schools
is 8.9:1. This compares with an average of 18.0:1
1
across
all state-funded schools in 2022.
For more detail on teaching assistants, see Appendix One, Table 20, p41
and Appendix Two, Table 13, p55.
For more detail see Appendix One, Tables 19 and 21, p41 and Appendix
Two, Tables 12 and 14, p54 and p55.
1
Based on Department for Education (DfE) data 2021/22 (and hence England only), the most recent year for which gures are available.
https://explore-education-statistics.service.gov.uk/nd-statistics/school-workforce-in-england
Full-time
Men 19,907
Women 28,720
Total 48,627
Part-time
Men 3,316
Women 14,359
Total 17,675
Part-time hours
Men 59,148
Women 284,147
Total 343,296
Overall full-time equivalent (32.5 hours = 1 full-time)
Men 21,727
Women 37,463
Total 59,190
Pupil-teacher ratio 8.9:1
Full-time
Men 950
Women 6,541
Total 7,491
Part-time
Men 346
Women 5,240
Total 5,586
Part-time hours
Men 6,318
Women 108,289
Total 114,607
Overall full-time equivalent (32.5 hours = 1 full-time)
Men 1,144
Women 9,873
Total 11,017
Teaching Staff

25
Entrance to Higher Education
The vast majority of ISC school leavers continue to higher
education. Only small numbers take alternative routes such as
apprenticeships and employment. This year 2.6% of school leavers
went straight to employment in 2022
1
and a further 1.7% entered
further education and training, including apprenticeships. This
represents increases of 0.3 and 0.6 percentage points respectively
compared with last year.
Of those continuing to higher education, 92% do so within
the UK. The majority (50%) continue to a Top 25 university
2
,
including 4% who continue to either Oxford or Cambridge. A
further 23% take up places at universities ranked 26-50. Figure
36 shows the top 25 UK universities attended by ISC pupils.
Schools were asked to break down the university destinations
of pupils applying for a deferred entry to university. Of those
continuing to university, 5,707 pupils (14.9%) chose to defer
entry. The universities with the highest proportions of
deferred entries were Oxford Brookes (22.9%), Bristol (18.2%),
and Newcastle upon Tyne (17.4%).
3
For the 6% of pupils who chose to study outside of the UK, the
USA is by far the most popular destination attracting 54% of ISC
pupils going to overseas universities, as illustrated in Figure 37.
This is an increase compared with last year when 47% chose to
study in the USA. ISC pupils go on to a wide range of overseas
universities and this range has been expanding year on year. In
2012, fewer than 400 overseas institutions attracted ISC pupils,
Fig 35. Higher education destination summary
Unknown
destination
Non-UK
university
UK universities
92%
Oxbridge 4%
Remaining
19%
Other Top 25
46%
1
The year given reects the year pupils left their school, rather than the year that the gure was published in the Census, meaning that the most recent gure is for 2022.
2
Top 25/50 universities determined by The Sunday Times Good University Guide 2023: https://www.thetimes.co.uk/article/good-university-guide-in-full-tp6dzs7wn.
3
Only universities which are the stated destination of at least 100 students.
Note: This chart excludes deferred entries.
now there are 553, 256 of which are located in the USA. The top
10 overseas universities are illustrated in Figure 38.
Finally, pupils choosing to study overseas are not conned to
a small number of ISC schools. Pupils from 57% of ISC schools
with Year 13 leavers go on to higher education overseas.
2%
6%
Top 26-50
23%

26
Fig 36. Destination of ISC pupils attending UK universities: Top 25
Number of pupils as a proportion of all ISC pupils attending UK universities.
Fig 37. Destination of ISC pupils going to non-UK universities:
Countries
Proportion of all ISC pupils attending non-UK universities.
Fig 38. Destination of ISC pupils attending non-UK universities:
Top 10
Proportion of all ISC pupils attending non-UK universities.
USA
Canada
Other
Hong Kong
Netherlands
France
Spain
Italy
Germany
Switzerland
Australia
Ireland
Japan
3.9%
3.8%
3.5%
3.5%
3.5%
3.2%
3.2%
3.1%
3.0%
2.8%
2.7%
2.5%
2.4%
2.4%
2.3%
2.3%
2.2%
2.1%
1.6%
1.6%
1.6%
1.6%
1.5%
1.5%
1.5%
Un
iv
er
si
ty
o
f
No
tt
in
gh
am
Un
iv
er
si
ty
o
f
Br
is
to
l
Du
rh
am
U
ni
ve
rs
it
y
Un
iv
er
si
ty
o
f
Ne
wc
as
tl
astl
as
e
up
on
T
yn
e
Un
iv
er
si
ty
o
f
Ex
et
er
Un
iv
er
si
ty
o
f
Ma
nc
he
st
er
Un
iv
er
si
ty
C
ol
le
ge
L
on
do
n
Un
iv
er
si
ty
o
f
Ba
th
Un
iv
er
si
ty
o
f
Ed
in
b
ur
gh
Un
iv
er
si
ty
o
f
Le
ed
s
Un
iv
er
si
ty
o
f
Wa
rw
ic
k
Lo
ug
hb
or
ou
orouor
gh
U
ni
ve
rs
it
y
Ki
ng's
C
ng's Cng's
ol
le
ge
L
ge Lge
on
do
n
Un
iv
er
si
ty
o
f
Ox
fo
rd
Ox
fo
rd
B
ro
ok
es
U
ni
ve
rs
it
y
Un
iv
er
si
ty
o
f
Bi
rm
in
gh
am
Un
iv
er
si
ty
o
f
Ca
mb
ri
dg
e
Un
iv
er
si
ty
o
f
Yo
rk
Im
pe
ri
al
C
ol
le
ge
L
on
do
n
Un
iv
er
si
ty
o
f
Gl
as
go
w
Un
iv
er
si
ty
o
f
So
ut
ha
mp
to
n
Un
iv
er
si
ty
o
f
Li
ve
rp
oo
l
Un
iv
er
si
ty
o
f
Re
ad
in
g
No
tt
in
gh
am
T
re
nt
U
ni
ve
rs
it
y
USA
Canada
Other
Hong Kong
Netherlands
France
Spain
Italy
Germany
Switzerland
Australia
Ireland
Japan
53.9%
7.1%
6.4%
6.0%
5.4%
4.8%
4.6%
3.2%
2.5%
2.2%
1.4%
1.3%
1.2%
2.9%
2.8%
2.8%
2.5%
2.2%
2.1%
1.7%
1.6%
1.5%
1.5%
University of Chicago (USA)
McGill University (Canada)
University of Hong Kong
New York University (USA)
IE University (Spain)
Columbia University (USA)
University of Toronto (Canada)
Yale University (USA)
Chinese University of Hong Kong
University of Southern California (USA)

27
0%
10%
20%
30%
40%
50%
60%
70%
80%
90%
100%
Other modern languages
Classical studies
Further maths
German
French
Music
Economics
Spanish
Drama and theatre studies
Government and politics
Design and technology
Maths
Religious studies
Physics
Chemistry
Logic/philosophy
English literature
Physical education
History
Art and design
Business studies
Geography
Biology
Psychology
Computer science
Other sciences
Film studies
English language/English language & literature
Sociology
For the past two years, ISC has been unable to report on the
examination performance of independent schools. This was
owing to the suspension of performance reporting by the DfE
during the Covid pandemic as grades were awarded by Centre
Assessed Grades (CAGs) or Teacher Assessed Grades (TAGs). In
summer 2022, grades were once again determined by external
examination, so for the rst time since the 2020 ISC Census, the
DfE has released detailed examination result data which are
analysed below. It should be noted that grade boundaries were
Exam Results
1
set more generously for this exam cycle to take into account
lost learning due to Covid lockdowns, so comparisons with
similar analyses in previous ISC Censuses should not be made.
As pupils at ISC member schools often take a mixture of GCSEs
and International GCSEs, the analysis below will focus on
A-level results. This is because the DfE only releases data about
GCSEs, meaning an analysis of these data would not be a true
re ection of our pupils’ performance.
1
DfE: Student counts and results – A-level by institution type and gender.
INDEPENDENT SCHOOL PUPILS
OVERREPRESENTED
STATE PUPILS
OVERREPRESENTED
State-funded institutions
Independent schools
Figure 39 shows the proportion of A-level entries for each
subject broken down by independent state schools. Despite
only 12%
1
of A-level students coming from independent
schools, the data illustrate that independent pupils are
over-represented in many key subjects, including mathematics,
natural sciences, and modern foreign languages (MFL). For
example, nearly a quarter (24%) of further mathematics
entries are from independent schools and over 1 in 5 (22%)
music entries are from independent pupils. In contrast, 92% of
computer science entries are from state-funded schools.
Fig 39. A-level entries as a proportion of all entries

28
Fig 40. Proportion A*/A (A-level) grades in England
Figure 40 illustrates the proportion of entries awarded the
two top A-level grades of A* and A in independent and state-
funded schools. It shows that independent school candidates
outperform state school entrants in many key subjects. For
example, in biology, chemistry, and physics, over half of
independent school entries are graded A* or A, compared with
state-funded school candidates where between 32% and 36%
received the top two grades in these science subjects. Looking
at the most popular modern foreign language subjects, two
thirds of independent school candidates received an A* or A
grade in French and Spanish and nearly three quarters (74%)
were awarded an A* or A in German. In contrast, less than
half of state-funded school candidates gained an A* or A in
French and Spanish, and just over half (53%) were awarded
A* or A in German.
Overall, nearly three in ve (58%) of A-level entries from
independent schools were awarded an A* or A grade. This
contrasts with state-funded schools where one in three (33%)
entries gained an A* or A grade. DfE data
1
also show that over
three quarters (77) of the top 100 schools and colleges ranked
by average A-level points score are independent schools.
1
DfE: school performance data – 16 to 18 results (revised).
Further maths
Maths
Biology
Chemistry
Physics
Computer science
Design and technology
Classical studies
French
German
Spanish
Other modern languages
Art and design
Music
Drama and theatre studies
Geography
History
Psychology
Sociology
English literature
0%
10%
20%
30%
40%
50%
60%
70%
80%
90%
STEM MFL & CLASSICS ARTS SOCIAL SCIENCES
State-funded institutions (A)
State-funded institutions (A*)
Independent schools (A)
Independent schools (A*)

29
Fig 41. The impact of independent schools on the UK economy
1
1
Excludes schools in the Channel Islands, Isle of Man, and grammar schools in Northern Ireland.
In 2022, ISC commissioned Oxford Economics, a leading
economic advisory rm with expertise in forecasting and
modelling, to analyse the impact of both all independent
schools and ISC member schools on the UK economy. The key
statistics are shown in Figure 41 below.
Based on data from ISC and other economic data from 2021,
Oxford Economics’ analysis discovered that ISC schools
contributed £14.1bn to the UK economy in Gross Value Added
(GVA) terms. This represents 0.7% of the entire UK economy and
is equivalent to the economic activity generated by a city the
size of She eld.
Their analysis also showed that the number of jobs supported
directly or indirectly by ISC schools was 281,980. This is
equivalent to the employed population of a city such as
Liverpool. Also, the research found that ISC schools supported
£4.3bn in tax revenues to the UK exchequer, which is su cient
to fund the salaries of 108,000 classroom teachers.
By parents choosing an independent education for their child
and not taking up a place in a state-funded school, the analysis
showed that ISC schools save the UK taxpayer £3.8bn annually.
Finally, it is important to note that non-British pupils attending
ISC schools have a disproportionate contribution to the UK
economy. Approximately 10% of pupils attending ISC schools
are non-British, but they support £2.1bn of the total GVA
contribution of ISC schools.
Economic Impact of Independent Schools on the UK Economy
2,559
schools
1,371
schools
Wider contribution
to the economy,
society, and state-
funded education
£5.1bn
£14.1bn
Demand-side
support for
GVA*
328,050
281,980
Jobs
Annual
tax
revenues
£4.3bn
£4.4bn
Annual
savings to
taxpayer
£3.8bn
All independent schools
THE IMPACT OF INDEPENDENT SCHOOLS
ON THE UK ECONOMY
*GVA = Gross Value Added
£2.1bn
GVA
supported by
non-British
pupils
ISC schools
£16.5bn

Appendix One
Non-Comparative Tables
The tables in Appendix One show gures for all 1,395 schools completing the Census this year and therefore
cannot be compared to previous years on a like-for-like basis. These tables follow the same format as last year.
30
Table 2. Pupil numbers by age
This table shows the number of pupils
in all ISC schools by age, gender and
day/boarding.
Table 1. School and pupil numbers by category of school
This table shows total school and pupil numbers, including a breakdown by category of school. The girls at “single-sex: boys’” schools and the boys
at “single-sex: girls’” schools are all in the nursery.
Schools Senior Mixed-age Junior
Single-sex:
boys’
Single-sex:
girls’ Co-ed
Schools
with
boarders
Day
schools Total
Charities 194 377 407 85 144 749 353 625 978
Other 67 118 232 21 15 381 81 336 417
Total 261 495 639 106 159 1,130 434 961 1,395
Not-for-prot 202 404 430 91 149 796 359 677 1,036
For-prot 59 91 209 15 10 334 75 284 359
Total 261 495 639 106 159 1,130 434 961 1,395
Pupils
Boarders (boys) 22,401 9,280 3,771 5,815 0 29,637 35,452 0 35,452
Boarders (girls) 20,162 8,491 2,220 0 7,558 23,315 30,873 0 30,873
Day pupils (boys) 44,161 121,186 80,024 41,174 210 203,987 79,142 166,229 245,371
Day pupils (girls) 39,336 138,919 64,292 181 71,159 171,207 68,627 173,920 242,547
Total (boys) 66,562 130,466 83,795 46,989 210 233,624 114,594 166,229 280,823
Total (girls) 59,498 147,410 66,512 181 78,717 194,522 99,500 173,920 273,420
Total 126,060 277,876 150,307 47,170 78,927 428,146 214,094 340,149 554,243
Age on 31st
August 2022
Boarders
(boys)
Day pupils
(boys)
Boarders
(girls)
Day pupils
(girls) Total
0-2 0 5,910 0 6,050 11,960
3 0 8,298 0 8,403 16,701
4 0 10,669 0 10,251 20,920
5 0 11,159 1 11,022 22,182
6 1 12,043 1 11,688 23,733
7 54 13,291 64 13,332 26,741
8 256 14,491 197 13,681 28,625
9 507 15,609 297 15,119 31,532
10 773 17,035 536 16,469 34,813
11 1,681 21,317 1,493 21,088 45,579
12 2,028 21,584 1,991 21,302 46,905
13 4,144 20,460 3,375 20,454 48,433
14 5,119 21,055 4,303 21,260 51,737
15 5,882 20,642 4,902 20,572 51,998
16 6,833 15,937 6,277 16,044 45,091
17 6,800 14,631 6,226 14,678 42,335
18 1,217 1,055 1,088 902 4,262
19 157 185 122 232 696
Total 35,452 245,371 30,873 242,547 554,243

31
Table 3. Pupil numbers
by year group
This table shows the number of
pupils in all ISC schools by year
group, gender and day/boarding.
Table 4. New pupil numbers
by year group
This table shows the number of
pupils new to their school this
academic year by year group,
gender and day/boarding.
Year group
Boarders
(boys)
Day pupils
(boys)
Boarders
(girls)
Day pupils
(girls) Total
Nursery 0 14,349 0 14,484 28,833
Reception 0 10,663 0 10,250 20,913
Year 1 0 11,173 1 11,007 22,181
Year 2 0 12,080 1 11,743 23,824
Year 3 53 13,291 64 13,334 26,742
Year 4 265 14,499 199 13,664 28,627
Year 5 512 15,643 299 15,122 31,576
Year 6 758 16,958 514 16,410 34,640
Year 7 1,734 21,469 1,518 21,053 45,774
Year 8 2,060 21,540 2,019 21,283 46,902
Year 9 4,344 20,593 3,464 20,494 48,895
Year 10 5,458 21,213 4,617 21,451 52,739
Year 11 5,879 20,668 4,715 20,554 51,816
Year 12 7,406 15,872 6,951 16,082 46,311
Year 13 6,983 15,360 6,511 15,616 44,470
Total 35,452 245,371 30,873 242,547 554,243
Year group
Boarders
(boys)
Day pupils
(boys)
Boarders
(girls)
Day pupils
(girls) Total
Nursery 0 7,264 0 7,306 14,570
Reception 0 4,837 0 4,609 9,446
Year 1 0 1,334 0 1,264 2,598
Year 2 0 1,374 0 1,350 2,724
Year 3 28 3,073 31 2,794 5,926
Year 4 132 1,971 69 1,561 3,733
Year 5 148 1,919 82 1,923 4,072
Year 6 195 1,821 127 1,675 3,818
Year 7 738 11,561 967 12,082 25,348
Year 8 348 1,384 432 1,601 3,765
Year 9 3,603 4,113 2,289 2,900 12,905
Year 10 1,338 1,087 1,415 1,426 5,266
Year 11 881 346 878 372 2,477
Year 12 2,951 2,151 3,480 3,693 12,275
Year 13 240 353 278 417 1,288
Total 10,602 44,588 10,048 44,973 110,211

32
Table 6. Fees by region (including nursery fees)
1
This table shows average termly fees by region and type of school. Please see Appendix Three, Figure 1, for denitions of regions.
Table 5. Pupil numbers by region
This table shows the number of pupils by region. Please see Appendix Three, Figure 1, for denitions of regions.
Region
1
No. of
schools
Boarders
(boys)
Day pupils
(boys)
Boarders
(girls)
Day pupils
(girls)
Total
boarders
Total day
pupils Total pupils
London 313 1,820 54,872 626 57,646 2,446 112,518 114,964
South Central 225 9,810 30,663 8,761 31,513 18,571 62,176 80,747
South East 195 6,695 34,276 6,440 32,394 13,135 66,670 79,805
East 153 3,074 30,166 3,041 28,454 6,115 58,620 64,735
West Midlands 103 2,491 16,280 2,221 16,005 4,712 32,285 36,997
South West 93 4,231 14,249 3,872 14,397 8,103 28,646 36,749
North West 91 1,290 17,579 944 16,995 2,234 34,574 36,808
East Midlands 71 2,323 10,477 1,550 10,580 3,873 21,057 24,930
Yorkshire and Humber 63 1,199 12,026 1,536 11,713 2,735 23,739 26,474
Scotland 34 1,326 11,461 1,061 11,714 2,387 23,175 25,562
Wales 18 724 2,999 542 3,144 1,266 6,143 7,409
North East 17 195 3,437 131 3,614 326 7,051 7,377
All
2
1,395 35,452 245,371 30,873 242,547 66,325 487,918 554,243
1
Northern Ireland, the Channel Islands and the Isle of Man are not listed due to the small number of schools in these regions.
2
The total includes data for schools in Northern Ireland, the Channel Islands and the Isle of Man.
Region
1
Boarding fee
Day fee
(boarding schools)
Day fee
(day schools)
London £14,692 £8,238 £6,676
South Central £13,602 £7,584 £5,555
South East £13,340 £8,003 £5,976
East £12,265 £7,207 £5,674
West Midlands £13,191 £6,370 £4,593
South West £12,970 £6,680 £4,880
North West £11,329 £5,647 £4,023
East Midlands £13,012 £7,683 £4,816
Yorkshire and Humber £8,125 £5,156 £4,599
Scotland £12,659 £7,477 £4,672
Wales £13,399 £5,268 £4,537
North East £9,524 £5,009 £4,660
All
2
£13,002 £7,175 £5,458
1
Northern Ireland, the Channel Islands and the Isle of Man are not listed due to the small number of schools in these regions.
2
The total includes data for schools in Northern Ireland, the Channel Islands and the Isle of Man.

33
Table 8a. Contributions to fees: senior, mixed-age and junior schools (termly values)
For ISC schools categorised by pupil age, this table shows the breakdown of contributions to fees by type of contribution.
Table 8b. Contributions to fees: single-sex and co-educational schools (termly values)
For ISC schools categorised by pupil gender, this table shows the breakdown of contributions to fees by type of contribution.
Table 7. Fees by age group (including nursery fees)
This table shows average termly fees for dierent age group in ISC schools.
Age group Boarding fee
Day fee
(boarding schools)
Day fee
(day schools)
Sixth form £13,676 £8,134 £6,025
Senior £12,787 £7,620 £5,854
Junior £9,320 £5,816 £5,108
Nursery £3,485 £4,071
Overall including nursery £13,002 £7,175 £5,458
Senior
(pupils)
Senior
(value £m)
Mixed-age
(pupils)
Mixed-age
(value £m)
Junior
(pupils)
Junior
(value £m)
Total
(pupils)
Total
(value £m)
% of all
pupils
The school 43,043 130.04 85,320 162.74 31,399 42.37 159,762 335.15 28.8
The school: means-tested: bursaries 12,453 66.94 21,399 74.11 5,506 13.85 39,358 154.90 7.1
The school: means-tested: scholarships 840 3.49 1,127 2.19 167 0.29 2,134 5.96 0.4
The school: means-tested: eligible families
1
327 0.87 1,555 2.22 661 0.88 2,543 3.97 0.5
The school: non-means-tested: scholarships 23,590 29.70 34,282 35.69 2,825 2.89 60,697 68.28 11.0
The school: non-means-tested: eligible families
1
12,263 29.05 39,338 48.51 23,834 24.05 75,435 101.62 13.6
The school: itrust
2
0 0.00 6 0.01 56 0.40 62 0.42 0.01
Early Years Funding 0 0.00 6,797 7.09 15,799 14.20 22,596 21.28 4.1
Local Authorities
3
973 10.87 3,603 30.16 242 1.51 4,818 42.54 0.9
Government Music and Dance Scheme 811 5.77 692 5.61 49 0.23 1,552 11.61 0.3
All other sources 670 2.52 762 2.16 389 1.14 1,821 5.83 0.3
Total 44,378 149.20 94,316 207.76 44,740 59.45 183,434 416.41 33.8
Number of pupils helped as a % of all pupils 36.2 34.9 29.9 33.8
1
Includes HM Forces discounts, sta discounts, sibling discounts and clergy discounts.
2
itrust is an IAPS charity supporting low-income families and families with short-term nancial diculties.
3
Excludes data for schools in Northern Ireland, the Channel Islands and the Isle of Man.
Single-sex:
boys’
(pupils)
Single-sex:
boys’
(value £m)
Single-sex:
girls’
(pupils)
Single-sex:
girls’
(value £m)
Co-ed
(pupils)
Co-ed
(value £m)
Total
(pupils)
Total
(value £m)
% of all
pupils
The school 8,289 24.51 19,995 45.01 131,478 265.64 159,762 335.15 28.8
The school: means-tested: bursaries 2,974 15.16 5,859 26.43 30,525 113.30 39,358 154.90 7.1
The school: means-tested: scholarships 181 1.00 186 0.64 1,767 4.32 2,134 5.96 0.4
The school: means-tested: eligible families
1
31 0.13 409 0.56 2,103 3.29 2,543 3.97 0.5
The school: non-means-tested: scholarships 3,536 3.74 10,221 9.25 46,940 55.30 60,697 68.28 11.0
The school: non-means-tested: eligible families
1
2,129 4.12 5,898 8.13 67,408 89.37 75,435 101.62 13.6
The school: itrust
2
28 0.36 2 0.00 32 0.05 62 0.42 0.01
Early Years Funding 485 0.43 1,316 1.18 20,795 19.67 22,596 21.28 4.1
Local Authorities
3
422 2.68 50 0.27 4,346 39.59 4,818 42.54 0.9
Government Music and Dance Scheme 10 0.01 3 0.00 1,539 11.59 1,552 11.61 0.3
All other sources 189 0.82 201 0.55 1,431 4.46 1,821 5.83 0.3
Total 8,803 28.44 21,139 47.02 153,492 340.95 183,434 416.41 33.8
Number of pupils helped as a % of all pupils 20.1 27.2 36.4 33.8
1
Includes HM Forces discounts, sta discounts, sibling discounts and clergy discounts.
2
itrust is an IAPS charity supporting low-income families and families with short-term nancial diculties.
3
Excludes data for schools in Northern Ireland, the Channel Islands and the Isle of Man.

34
Table 9. Non-British pupils whose parents live overseas
This table shows the number of non-British pupils whose parents live overseas by country/area of residence.
Table 8c. Contributions to fees: day and boarding schools (termly values)
For ISC schools categorised by day and boarding, this table shows the breakdown of contributions to fees by type of contribution.
Schools with
boarders
(pupils)
Schools with
boarders
(value £m)
Day schools
(pupils)
Day schools
(value £m)
Total
(pupils)
Total
(value £m) % of all pupils
The school 78,762 203.29 81,000 131.87 159,762 335.15 28.8
The school: means-tested: bursaries 20,021 89.96 19,337 64.94 39,358 154.90 7.1
The school: means-tested: scholarships 1,162 4.30 972 1.66 2,134 5.96 0.4
The school: means-tested: eligible families
1
1,087 2.23 1,456 1.74 2,543 3.97 0.5
The school: non-means-tested: scholarships 34,695 45.12 26,002 23.16 60,697 68.28 11.0
The school: non-means-tested: eligible families
1
34,577 61.29 40,858 40.33 75,435 101.62 13.6
The school: itrust
2
45 0.38 17 0.04 62 0.42 0.01
Early Years Funding 4,176 3.61 18,420 17.67 22,596 21.28 4.1
Local Authorities
3
1,230 8.79 3,588 33.75 4,818 42.54 0.9
Government Music and Dance Scheme 1,552 11.61 0 0.00 1,552 11.61 0.3
All other sources
884 3.60 937 2.23 1,821 5.83 0.3
Total 84,066 230.89 99,368 185.52 183,434 416.41 33.8
Number of pupils helped as a % of all pupils 39.9 29.9 33.8
1
Includes HM Forces discounts, sta discounts, sibling discounts and clergy discounts.
2
itrust is an IAPS charity supporting low-income families and families with short-term nancial diculties.
3
Excludes data for schools in Northern Ireland, the Channel Islands and the Isle of Man.
Senior Mixed-age Junior
Single-sex:
boys’
Single-sex:
girls’ Co-ed
Schools with
boarders Day schools Total
France 198 159 46 19 20 364 395 8 403
Germany 988 1,099 12 35 60 2,004 2,090 9 2,099
Russia 741 278 37 25 32 999 1,029 27 1,056
Spain 554 606 304 89 146 1,229 1,425 39 1,464
Ireland 30 33 1 7 2 55 58 6 64
Italy 289 119 6 2 12 400 409 5 414
Poland 57 47 4 2 8 98 107 1 108
Romania 85 25 3 1 6 106 112 1 113
Ukraine 447 298 41 10 28 748 727 59 786
Remainder of Europe (EEA) 777 526 30 40 90 1,203 1,307 26 1,333
Remainder of Europe (non-EEA) 473 198 11 16 21 645 665 17 682
Nigeria 566 246 34 21 90 735 788 58 846
Rest of Africa 370 273 15 12 48 598 625 33 658
USA 190 134 30 19 46 289 347 7 354
Rest of North America 100 47 4 3 9 139 148 3 151
Central and South America 268 223 7 11 45 442 492 6 498
Middle East 426 165 13 18 30 556 573 31 604
Hong Kong 3,326 2,191 137 390 1,001 4,263 5,549 105 5,654
Mainland China 2,906 1,590 210 227 656 3,823 4,521 185 4,706
Taiwan 67 38 10 2 10 103 110 5 115
Japan 287 133 57 38 29 410 472 5 477
South Korea 272 80 26 23 43 312 355 23 378
Malaysia 237 39 1 15 20 242 270 7 277
Thailand 467 200 40 39 86 582 699 8 707
India 145 74 12 13 15 203 218 13 231
Pakistan, Sri Lanka and Bangladesh 43 27 5 1 9 65 69 6 75
Central Asia 233 73 6 1 9 302 297 15 312
Remainder of Far East 595 193 22 37 76 697 735 75 810
Oceania 65 23 6 9 12 73 91 3 94
Total 15,202 9,137 1,130 1,125 2,659 21,685 24,683 786 25,469
As a % of all pupils 12.1% 3.3% 0.8% 2.4% 3.4% 5.1% 11.5% 0.2% 4.6%

35
Table 10. Non-British pupils whose parents live in the UK
This table shows the number of non-British pupils whose parents live in the UK by country/area of nationality.
Senior Mixed-age Junior
Single-sex:
boys’
Single-sex:
girls’ Co-ed
Schools with
boarders Day schools Total
France 417 1,929 647 218 326 2,449 600 2,393 2,993
Germany 289 612 316 160 246 811 475 742 1,217
Russia 257 339 340 114 153 669 412 524 936
Spain 222 826 248 117 203 976 340 956 1,296
Ireland 418 661 249 136 309 883 539 789 1,328
Italy 377 667 356 194 274 932 420 980 1,400
Poland 110 222 84 28 75 313 158 258 416
Romania 80 132 88 16 33 251 109 191 300
Ukraine 331 601 355 67 192 1,028 661 626 1,287
Remainder of Europe (EEA) 1,067 1,985 1,045 449 727 2,921 1,501 2,596 4,097
Remainder of Europe (non-EEA) 247 373 225 73 151 621 301 544 845
Nigeria 166 385 132 50 106 527 339 344 683
Rest of Africa 235 683 308 66 196 964 522 704 1,226
USA 620 2,625 1,230 312 503 3,660 1,703 2,772 4,475
Rest of North America 106 328 165 49 92 458 219 380 599
Central and South America 103 298 172 28 64 481 217 356 573
Middle East 154 854 255 51 100 1,112 186 1,077 1,263
Hong Kong 759 1,309 289 231 555 1,571 1,433 924 2,357
Mainland China 954 1,891 1,193 604 929 2,505 1,924 2,114 4,038
Taiwan 8 19 15 5 7 30 15 27 42
Japan 111 263 268 53 112 477 169 473 642
South Korea 132 209 141 48 136 298 175 307 482
Malaysia 41 83 47 25 42 104 61 110 171
Thailand 25 34 16 3 11 61 50 25 75
India 218 1,032 445 205 440 1,050 330 1,365 1,695
Pakistan, Sri Lanka and Bangladesh 99 280 65 53 127 264 80 364 444
Central Asia 62 87 51 6 28 166 93 107 200
Remainder of Far East 80 141 91 36 62 214 128 184 312
Oceania 218 422 302 81 162 699 402 540 942
Total 7,906 19,290 9,138 3,478 6,361 26,495 13,562 22,772 36,334
As a % of all pupils 6.3% 6.9% 6.1% 7.4% 8.1% 6.2% 6.3% 6.7% 6.6%

36
Table 11. New non-British pupils whose parents live overseas
This table shows the number of new non-British pupils whose parents live overseas by country/area of residence.
Senior Mixed-age Junior
Single-sex:
boys’
Single-sex:
girls’ Co-ed
Schools with
boarders Day schools Total
France 97 99 38 4 7 223 232 2 234
Germany 641 768 6 22 41 1,352 1,408 7 1,415
Russia 291 118 17 5 5 416 409 17 426
Spain 358 455 251 55 102 907 1,039 25 1,064
Ireland 9 10 1 3 0 17 18 2 20
Italy 128 59 2 0 4 185 188 1 189
Poland 25 29 1 0 6 49 55 0 55
Romania 28 8 1 0 0 37 37 0 37
Ukraine 274 153 18 9 13 423 416 29 445
Remainder of Europe (EEA) 373 260 13 16 46 584 630 16 646
Remainder of Europe (non-EEA) 261 103 4 5 8 355 357 11 368
Nigeria 214 100 10 1 20 303 288 36 324
Rest of Africa 130 108 4 4 19 219 227 15 242
USA 81 69 13 4 14 145 158 5 163
Rest of North America 58 32 1 1 3 87 91 0 91
Central and South America 181 150 6 9 32 296 334 3 337
Middle East 219 67 6 3 9 280 278 14 292
Hong Kong 1,156 675 62 108 310 1,475 1,850 43 1,893
Mainland China 1,163 558 100 67 203 1,551 1,749 72 1,821
Taiwan 32 14 6 1 3 48 50 2 52
Japan 105 63 21 8 15 166 186 3 189
South Korea 110 40 14 7 11 146 151 13 164
Malaysia 108 11 0 2 5 112 114 5 119
Thailand 214 102 19 6 34 295 333 2 335
India 58 28 5 3 4 84 88 3 91
Pakistan, Sri Lanka and Bangladesh 19 15 1 0 3 32 33 2 35
Central Asia 94 34 3 0 2 129 124 7 131
Remainder of Far East 287 75 8 13 31 326 344 26 370
Oceania 35 12 3 5 4 41 49 1 50
Total 6,749 4,215 634 361 954 10,283 11,236 362 11,598
As a % of all new pupils 21.6% 8.5% 2.1% 4.1% 6.7% 11.8% 22.8% 0.6% 10.5%

37
Table 13. British pupils with parents living overseas
This table shows the number of British pupils whose parents live abroad or serve in HM Forces, as well as the number who are new to their
school this year.
Table 12. New non-British pupils whose parents live in the UK
This table shows the number of new non-British pupils whose parents live in the UK by country/area of nationality.
Senior Mixed-age Junior
Single-sex:
boys’
Single-sex:
girls’ Co-ed
Schools with
boarders Day schools Total
France 94 400 144 32 40 566 137 501 638
Germany 73 100 58 29 30 172 115 116 231
Russia 68 66 87 16 28 177 103 118 221
Spain 59 178 62 28 50 221 109 190 299
Ireland 94 115 46 29 43 183 128 127 255
Italy 84 118 67 29 51 189 91 178 269
Poland 27 43 20 3 14 73 45 45 90
Romania 22 26 24 3 2 67 28 44 72
Ukraine 185 294 180 35 107 517 324 335 659
Remainder of Europe (EEA) 258 322 239 66 133 620 317 502 819
Remainder of Europe (non-EEA) 72 92 48 9 29 174 85 127 212
Nigeria 43 126 39 10 20 178 84 124 208
Rest of Africa 65 168 90 17 55 251 143 180 323
USA 188 647 371 68 119 1,019 503 703 1,206
Rest of North America 35 93 49 12 29 136 63 114 177
Central and South America 41 89 48 7 12 159 78 100 178
Middle East 49 316 102 6 26 435 59 408 467
Hong Kong 308 462 113 91 204 588 521 362 883
Mainland China 283 499 354 157 234 745 560 576 1,136
Taiwan 4 6 7 2 3 12 5 12 17
Japan 30 76 63 8 27 134 44 125 169
South Korea 45 61 40 12 38 96 63 83 146
Malaysia 10 21 13 4 6 34 18 26 44
Thailand 10 7 3 0 1 19 18 2 20
India 59 252 128 44 108 287 88 351 439
Pakistan, Sri Lanka and Bangladesh 27 50 22 9 22 68 29 70 99
Central Asia 16 34 21 1 9 61 36 35 71
Remainder of Far East 24 41 31 5 21 70 34 62 96
Oceania 57 110 98 18 41 206 117 148 265
Total 2,330 4,812 2,567 750 1,502 7,457 3,945 5,764 9,709
As a % of all new pupils 7.5% 9.7% 8.7% 8.6% 10.6% 8.5% 8.0% 9.5% 8.8%
British pupils whose parents: Senior Mixed-age Junior
Single-sex:
boys’
Single-sex:
girls’ Co-ed
Schools
with
boarders
Day
schools Total
Live abroad 2,264 1,001 177 266 469 2,707 3,298 144 3,442
Serve in HM Forces 1,418 1,850 1,302 126 267 4,177 3,995 575 4,570
New British pupils whose parents:
Live abroad 661 316 78 41 118 896 1,017 38 1,055
Serve in HM Forces 235 245 275 18 35 702 653 102 755
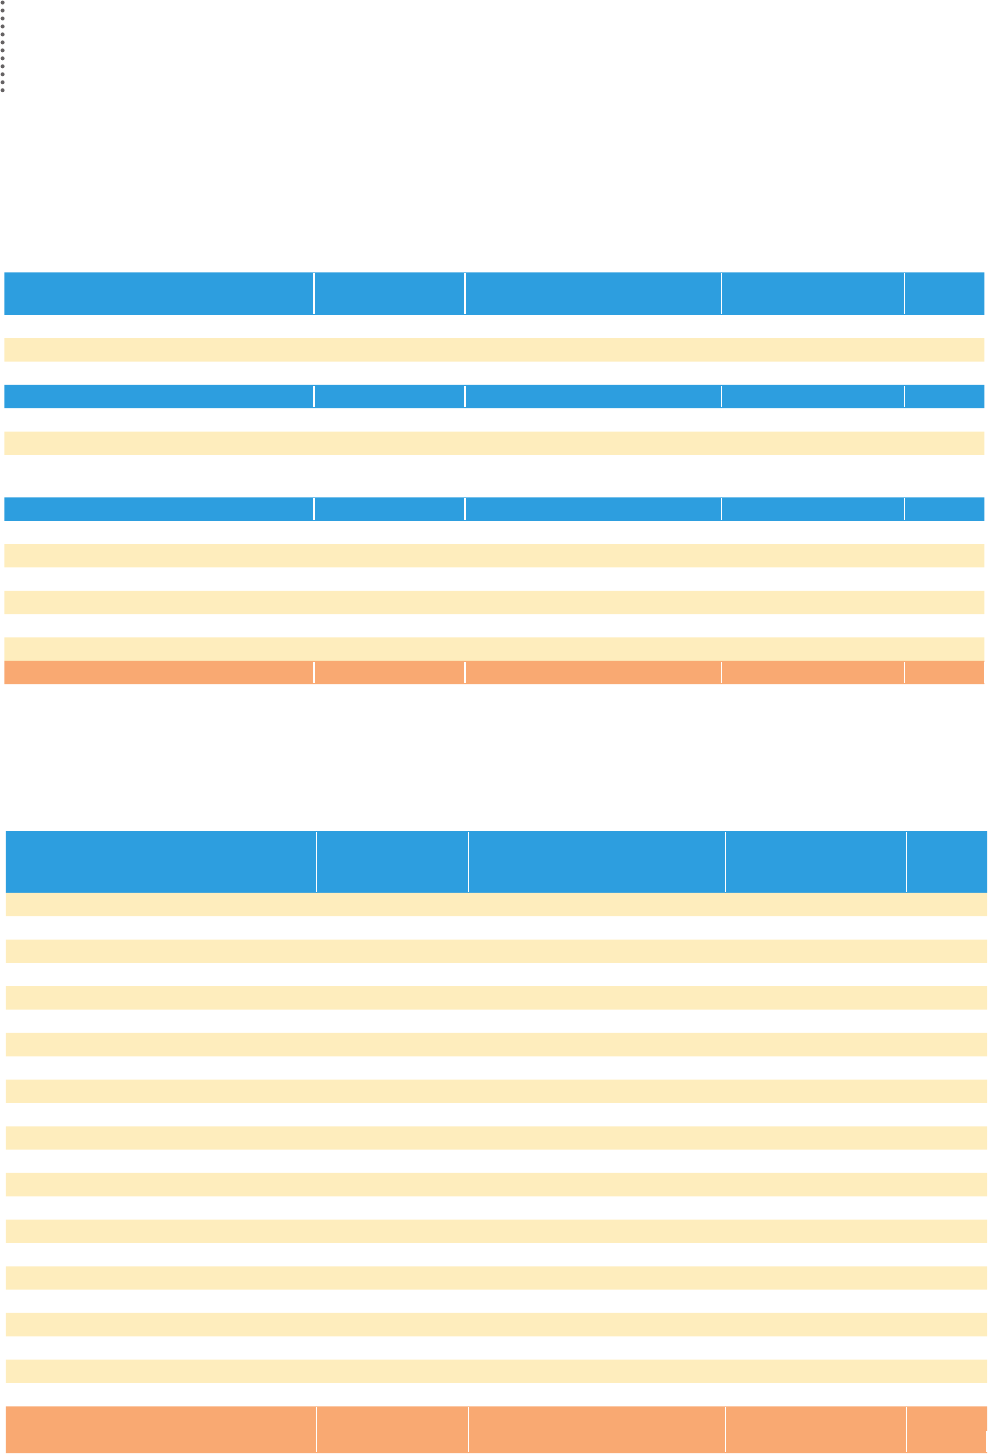
38
Table 15. Destination of pupils going to non-UK universities
This table shows the destination of post-18 school leavers going to non-UK universities from ISC schools.
Table 14. Destination of post-18 school leavers
This table shows the percentage of school leavers in all ISC schools arriving at various destinations post-18.
Non-deferred university entries Senior Mixed-age
Single-sex:
boys’
Single-sex:
girls’ Co-ed
Schools
with boarders
Day
schools Total
% to UK universities 66.6 71.6 70.8 75.1 67.8 65.4 74.1 69.1
% to overseas universities 5.4 3.7 4.7 3.9 4.6 5.6 3.1 4.5
% to unknown university 2.4 1.4 2.7 1.1 1.9 2.5 1.0 1.8
Deferred university entries
% to UK universities 7.6 4.9 5.6 5.3 6.5 7.5 4.6 6.2
% to overseas universities 0.2 0.2 0.3 0.1 0.2 0.3 0.1 0.2
% to unknown university (incl. planning
post-qualication application) 8.0 5.6 7.0 7.3 6.6 7.2 6.2 6.8
Other
% to other higher education courses 1.6 1.7 1.1 1.7 1.7 1.8 1.4 1.6
% to further education or training 1.3 2.1 1.1 0.7 1.9 1.5 1.9 1.7
% to re-take A-levels 1.3 0.8 3.2 1.1 0.8 1.1 1.1 1.1
% to employment 1.8 3.3 1.8 1.1 3.0 2.0 3.3 2.6
% to other 1.3 1.5 0.9 1.1 1.6 1.5 1.4 1.4
% to unknown 2.6 3.3 1.0 1.5 3.4 3.8 1.8 2.9
Total number recorded 21,037 22,218 3,928 6,285 33,042 24,606 18,649 43,255
Senior Mixed-age
Single-sex:
boys’
Single-sex:
girls’ Co-ed
Schools
with
boarders
Day
schools Total
USA 603 465 139 147 782 708 360 1,068
Canada 92 49 20 23 98 95 46 141
Hong Kong 78 41 9 13 97 111 8 119
Netherlands 55 51 3 9 94 75 31 106
France 32 63 1 7 87 42 53 95
Spain 63 29 2 7 83 70 22 92
Italy 33 30 4 6 53 51 12 63
Germany 31 19 0 3 47 49 1 50
Switzerland 28 15 0 4 39 38 5 43
Australia 19 8 2 1 24 25 2 27
Ireland 19 7 1 6 19 16 10 26
Japan 15 9 1 1 22 18 6 24
Bulgaria 5 9 0 2 12 7 7 14
Cyprus 7 5 1 0 11 4 8 12
Belgium 6 5 0 3 8 9 2 11
China 7 2 0 3 6 8 1 9
UAE 7 1 1 0 7 8 0 8
Czechia 2 5 1 0 6 5 2 7
Poland 6 0 0 0 6 5 1 6
Austria 4 1 1 0 4 5 0 5
Thailand 3 2 0 0 5 4 1 5
Other countries 26 24 5 7 38 38 12 50
Total 1,141 840 191 242 1,548 1,391 590 1,981
% of all pupils going to higher education 5.9% 4.2% 5.3% 4.1% 5.2% 6.3% 3.5% 5.1%

39
Table 16. Size of schools
This table shows all ISC schools by type and various size brackets.
School size Senior Mixed-age Junior
Single-sex:
boys’
Single-sex:
girls’ Co-ed
Schools with
boarders Day schools Total
1 - 50 22 15 21 1 1 56 3 55 58
51 - 100 15 28 67 7 4 99 17 93 110
101 - 150 19 28 119 10 13 143 20 146 166
151 - 200 13 41 90 16 11 117 35 109 144
201 - 250 20 24 84 8 15 105 39 89 128
251 - 300 5 27 84 9 11 96 27 89 116
301 - 350 8 24 56 11 8 69 28 60 88
351 - 400 17 20 46 10 4 69 35 48 83
401 - 450 9 27 26 5 15 42 32 30 62
451 - 500 13 22 19 2 7 45 26 28 54
501 - 550 9 27 9 1 7 37 15 30 45
551 - 600 20 19 5 1 8 35 25 19 44
601 - 650 11 17 4 1 9 22 19 13 32
651 - 700 10 18 4 2 4 26 19 13 32
701 - 750 5 17 2 0 7 17 9 15 24
751 - 800 12 22 0 2 8 24 15 19 34
801 - 850 10 10 2 2 2 18 14 8 22
851 - 900 9 15 0 3 6 15 12 12 24
901 - 950 12 8 0 1 2 17 9 11 20
951 - 1000 2 10 0 0 4 8 2 10 12
1001 - 1050 4 10 0 1 5 8 4 10 14
1051 - 1100 5 11 0 1 2 13 7 9 16
1101 - 1150 4 5 1 2 2 6 2 8 10
1151 - 1200 3 12 0 2 4 9 3 12 15
1201 - 1250 0 4 0 1 0 3 2 2 4
1251 - 1300 1 7 0 1 0 7 4 4 8
1301 - 1350 3 6 0 3 0 6 4 5 9
1351 - 1400 0 2 0 0 0 2 1 1 2
1401 - 1450 0 1 0 0 0 1 0 1 1
1451 - 1500 0 0 0 0 0 0 0 0 0
1501 - 1550 0 6 0 1 0 5 1 5 6
1551 - 1600 0 1 0 1 0 0 1 0 1
1601 - 1650 0 1 0 0 0 1 0 1 1
1651 - 1700 0 3 0 1 0 2 1 2 3
1701+ 0 7 0 0 0 7 3 4 7
Total 261 495 639 106 159 1,130 434 961 1,395
Mean size 483 561 235 445 496 379 493 354 397
Median size 464 478 211 321 441 274 414 240 291

40
Table 17. Boarders as a
percentage of all pupils
This table shows all ISC
schools grouped by type
and percentage of boarders.
Table 18. Boys as a
percentage of all pupils
This table shows all ISC
schools grouped by type
and percentage of boys.
% boarders Senior
Mixed-
age Junior
Single-sex:
boys’
Single-sex:
girls’ Co-ed
Schools
with
boarders
Day
schools Total
0 106 334 521 71 118 772 0 961 961
1 - 4 2 15 11 5 1 22 28 0 28
5 - 9 7 32 34 3 3 67 73 0 73
10 - 14 9 32 14 7 5 43 55 0 55
15 - 19 7 22 17 1 6 39 46 0 46
20 - 24 9 16 7 1 2 29 32 0 32
25 - 29 5 8 6 0 2 17 19 0 19
30 - 34 4 6 6 1 2 13 16 0 16
35 - 39 12 9 6 1 4 22 27 0 27
40 - 44 8 3 5 1 1 14 16 0 16
45 - 49 10 2 3 0 3 12 15 0 15
50 - 54 9 3 2 2 0 12 14 0 14
55 - 59 4 2 1 3 1 3 7 0 7
60 - 64 7 4 1 1 1 10 12 0 12
65 - 69 3 0 0 0 0 3 3 0 3
70 - 74 9 4 1 0 1 13 14 0 14
75 - 79 11 0 1 2 1 9 12 0 12
80 - 84 12 1 0 0 2 11 13 0 13
85 - 89 5 0 0 0 1 4 5 0 5
90 - 94 8 0 0 1 2 5 8 0 8
95 - 99 10 1 0 0 2 9 11 0 11
100 4 1 3 6 1 1 8 0 8
Total 261 495 639 106 159 1,130 434 961 1,395
% boarders 33.8% 6.4% 4.0% 12.3% 9.6% 12.4% 31.0% 0.0% 12.0%
% boys Senior
Mixed-
age Junior
Single-sex:
boys’
Single-sex:
girls’ Co-ed
Schools
with
boarders
Day
schools Total
0 46 69 24 0 139 0 38 101 139
1 - 4 1 14 6 0 13 8 7 14 21
5 - 9 0 4 4 0 4 4 1 7 8
10 - 14 0 3 5 0 3 5 1 7 8
15 - 19 1 2 0 0 0 3 1 2 3
20 - 24 3 2 1 0 0 6 3 3 6
25 - 29 0 7 4 0 0 11 4 7 11
30 - 34 4 3 4 0 0 11 2 9 11
35 - 39 5 6 9 0 0 20 6 14 20
40 - 44 7 13 24 0 0 44 9 35 44
45 - 49 16 52 112 0 0 180 37 143 180
50 - 54 41 131 172 0 0 344 115 229 344
55 - 59 58 93 137 0 0 288 111 177 288
60 - 64 22 35 42 0 0 99 35 64 99
65 - 69 12 15 16 0 0 43 16 27 43
70 - 74 5 8 5 0 0 18 2 16 18
75 - 79 2 4 4 0 0 10 2 8 10
80 - 84 2 2 1 0 0 5 1 4 5
85 - 89 4 3 4 2 0 9 3 8 11
90 - 94 5 8 4 2 0 15 2 15 17
95 - 99 4 2 11 10 0 7 7 10 17
100 23 19 50 92 0 0 31 61 92
Total 261 495 639 106 159 1,130 434 961 1,395
% boys 52.8% 47.0% 55.7% 99.6% 0.3% 54.6% 53.5% 48.9% 50.7%

41
Table 19. Teacher numbers
1
This table shows the number of teachers in all ISC schools by type of school.
Table 20. Teaching assistant numbers
1
This table shows the number of teaching assistants in all ISC schools by type of school.
Table 21. Pupil-teacher ratios
This table shows the pupil and teacher gender ratios, along with the overall pupil-teacher ratio in ISC schools.
Full-time Senior Mixed-age Junior
Single-sex:
boys’
Single-sex:
girls’ Co-ed
Schools with
boarders Day schools Total
Men 6,907 9,528 3,472 2,660 1,728 15,519 10,361 9,546 19,907
Women 6,436 14,177 8,107 1,825 4,905 21,990 11,433 17,287 28,720
Total 13,343 23,705 11,579 4,485 6,633 37,509 21,794 26,833 48,627
Part-time
Men 1,201 1,568 547 377 438 2,501 1,524 1,792 3,316
Women 3,308 7,324 3,727 701 3,134 10,524 5,352 9,007 14,359
Total 4,509 8,892 4,274 1,078 3,572 13,025 6,876 10,799 17,675
Part-time hours
Men 20,776 28,535 9,837 6,232 8,132 44,784 27,051 32,097 59,148
Women 61,771 148,346 74,030 13,843 59,972 210,332 104,201 179,946 284,147
Total 82,547 176,882 83,867 20,075 68,104 255,116 131,252 212,044 343,296
Overall full-time equivalent (32.5 hours = 1 full-time)
Men 7,546 10,406 3,775 2,852 1,978 16,897 11,193 10,534 21,727
Women 8,337 18,742 10,385 2,251 6,750 28,462 14,639 22,824 37,463
Total 15,883 29,148 14,160 5,103 8,729 45,359 25,833 33,357 59,190
1
Excludes nursery sta.
Full-time Senior Mixed-age Junior
Single-sex:
boys’
Single-sex:
girls’ Co-ed
Schools with
boarders Day schools Total
Men 134 437 379 113 41 796 314 636 950
Women 372 2,664 3,505 431 610 5,500 1,496 5,045 6,541
Total 506 3,101 3,884 544 651 6,296 1,810 5,681 7,491
Part-time
Men 69 162 115 29 24 293 115 231 346
Women 406 2,309 2,525 250 612 4,378 1,560 3,680 5,240
Total 475 2,471 2,640 279 636 4,671 1,675 3,911 5,586
Part-time hours
Men 1,114 2,984 2,220 611 358 5,349 2,118 4,200 6,318
Women 6,574 48,927 52,788 5,360 11,596 91,333 31,481 76,808 108,289
Total 7,688 51,911 55,008 5,971 11,954 96,682 33,599 81,008 114,607
Overall full-time equivalent (32.5 hours = 1 full-time)
Men 168 529 447 132 52 961 379 765 1,144
Women 574 4,169 5,129 596 967 8,310 2,465 7,408 9,873
Total 743 4,698 5,577 728 1,019 9,271 2,844 8,174 11,017
1
Excludes nursery sta.
Pupils Senior Mixed-age Junior
Single-sex:
boys’
Single-
sex:girls’ Co-ed
Schools with
boarders
Day
schools Total
Boys 66,562 130,466 83,795 46,989 210 233,624 114,594 166,229 280,823
Girls 59,498 147,410 66,512 181 78,717 194,522 99,500 173,920 273,420
Total 126,060 277,876 150,307 47,170 78,927 428,146 214,094 340,149 554,243
Gender ratios
Boys:girls (pupils) 1.1:1 0.9:1 1.3:1 259.6:1 0.0:1 1.2:1 1.2:1 1.0:1 1.0:1
Men:women (teachers)
1
0.9:1 0.6:1 0.4:1 1.3:1 0.3:1 0.6:1 0.8:1 0.5:1 0.6:1
Men:women (teaching assistants)
1
0.3:1 0.1:1 0.1:1 0.2:1 0.1:1 0.1:1 0.2:1 0.1:1 0.1:1
Pupil-teacher ratio
2
7.9:1 9.2:1 9.3:1 9.1:1 8.9:1 8.9:1 8.0:1 9.5:1 8.9:1
1
Excludes nursery sta.
2
Pupil-teacher ratios exclude nursery teachers and nursery pupils.

42
Table 22. Changes to full-time teachers
This table shows the number of full-time teachers coming into ISC schools (broken down by previous occupation) and leaving ISC
schools (broken down by destination).
Table 23. SEND pupils
1
This table shows the number of pupils who have been identied with SEND.
Arriving from Senior
Mixed-
age Junior
Single-
sex:
boys’
Single-
sex:
girls’ Co-ed
Schools
with
boarders
Day
schools Total
Independent schools 726 1,083 663 226 401 1,845 1,193 1,279 2,472
State-funded schools 545 1,564 650 168 421 2,170 1,030 1,729 2,759
ITT at university or training college 123 232 73 24 67 337 163 265 428
New graduates 108 149 81 30 36 272 154 184 338
Industry 49 125 33 19 23 165 103 104 207
Outside the UK 164 322 159 53 72 520 312 333 645
Retirement 7 29 12 2 6 40 15 33 48
Maternity leave 101 241 146 21 98 369 135 353 488
Part-time 177 313 130 34 127 459 263 357 620
Other 221 436 182 48 147 644 393 446 839
Total 2,221 4,494 2,129 625 1,398 6,821 3,761 5,083 8,844
Going to
Independent schools 531 738 544 215 264 1,334 794 1,019 1,813
State-funded schools 201 502 228 52 120 759 391 540 931
Industry 125 207 80 31 57 324 200 212 412
Outside the UK 101 216 103 30 52 338 167 253 420
Retirement 198 461 217 57 159 660 395 481 876
Maternity leave 156 380 234 43 143 584 246 524 770
Part-time 171 436 230 56 155 626 320 517 837
Other 503 996 439 117 326 1,495 803 1,135 1,938
Total 1,986 3,936 2,075 601 1,276 6,120 3,316 4,681 7,997
Net gain
Independent schools 195 345 119 11 137 511 399 260 659
State-funded schools 344 1,062 422 116 301 1,411 639 1,189 1,828
Industry -76 -82 -47 -12 -34 -159 -97 -108 -205
Outside the UK 63 106 56 23 20 182 145 80 225
Retirement -191 -432 -205 -55 -153 -620 -380 -448 -828
Maternity leave -55 -139 -88 -22 -45 -215 -111 -171 -282
Part-time 6 -123 -100 -22 -28 -167 -57 -160 -217
Other -282 -560 -257 -69 -179 -851 -410 -689 -1,099
Total 235 558 54 24 122 701 445 402 847
Full-time teachers
Turnover as % of full-time teachers 14.9 16.6 17.9 13.4 19.2 16.3 15.2 17.4 16.4
Gain as % of full-time teachers 1.8 2.4 0.5 0.5 1.8 1.9 2.0 1.5 1.7
Total 13,343 23,705 11,579 4,485 6,633 37,509 21,794 26,833 48,627
Types of SEND Senior
Mixed-
age Junior
Single-
sex:
boys’
Single-
sex:
girls’ Co-ed
Schools
with
boarders
Day
schools Total
Specic learning diculty (SpLD) 17,222 28,387 9,495 3,939 7,241 43,924 26,385 28,719 55,104
Moderate learning diculty (MLD) 716 1,729 1,232 355 429 2,893 1,676 2,001 3,677
Severe learning diculty (SLD) 37 123 76 5 11 220 114 122 236
Profound and multiple learning diculty (PMLD) 44 64 30 5 12 121 36 102 138
Social, emotional and mental health (SEMH) 5,178 9,798 2,943 1,330 2,419 14,170 6,902 11,017 17,919
Speech, language and communication needs (SLCN) 977 3,973 3,449 789 524 7,086 2,639 5,760 8,399
Hearing impairment (HI) 419 1,033 419 160 292 1,419 646 1,225 1,871
Visual impairment (VI) 526 1,066 308 307 221 1,372 682 1,218 1,900
Multi-Sensory impairment (MSI) 79 379 181 95 54 490 241 398 639
Physical diculty (PD) 695 1,449 424 316 417 1,835 760 1,808 2,568
Autistic spectrum disorder (ASD) 2,311 5,890 1,796 790 994 8,213 3,495 6,502 9,997
Other diculty/disability 1,311 2,880 1,153 508 837 3,999 2,085 3,259 5,344
SEN support but no specialist assessment of type of need 2,216 7,370 6,053 1,565 1,582 12,492 6,146 9,493 15,639
Total 27,103 52,709 23,525 8,725 12,875 81,737 43,757 59,580 103,337
% pupils with SEND 21.5% 19.0% 15.7% 18.5% 16.3% 19.1% 20.4% 17.5% 18.6%
1
Some pupils have more than one SEND; they are counted under each individual category of SEND, but are counted only once in the total.

Arriving from Senior
Mixed-
age Junior
Single-
sex:
boys’
Single-
sex:
girls’ Co-ed
Schools
with
boarders
Day
schools Total
Independent schools 726 1,083 663 226 401 1,845 1,193 1,279 2,472
State-funded schools 545 1,564 650 168 421 2,170 1,030 1,729 2,759
ITT at university or training college 123 232 73 24 67 337 163 265 428
New graduates 108 149 81 30 36 272 154 184 338
Industry 49 125 33 19 23 165 103 104 207
Outside the UK 164 322 159 53 72 520 312 333 645
Retirement 7 29 12 2 6 40 15 33 48
Maternity leave 101 241 146 21 98 369 135 353 488
Part-time 177 313 130 34 127 459 263 357 620
Other 221 436 182 48 147 644 393 446 839
Total 2,221 4,494 2,129 625 1,398 6,821 3,761 5,083 8,844
Going to
Independent schools 531 738 544 215 264 1,334 794 1,019 1,813
State-funded schools 201 502 228 52 120 759 391 540 931
Industry 125 207 80 31 57 324 200 212 412
Outside the UK 101 216 103 30 52 338 167 253 420
Retirement 198 461 217 57 159 660 395 481 876
Maternity leave 156 380 234 43 143 584 246 524 770
Part-time 171 436 230 56 155 626 320 517 837
Other 503 996 439 117 326 1,495 803 1,135 1,938
Total 1,986 3,936 2,075 601 1,276 6,120 3,316 4,681 7,997
Net gain
Independent schools 195 345 119 11 137 511 399 260 659
State-funded schools 344 1,062 422 116 301 1,411 639 1,189 1,828
Industry -76 -82 -47 -12 -34 -159 -97 -108 -205
Outside the UK 63 106 56 23 20 182 145 80 225
Retirement -191 -432 -205 -55 -153 -620 -380 -448 -828
Maternity leave -55 -139 -88 -22 -45 -215 -111 -171 -282
Part-time 6 -123 -100 -22 -28 -167 -57 -160 -217
Other -282 -560 -257 -69 -179 -851 -410 -689 -1,099
Total 235 558 54 24 122 701 445 402 847
Full-time teachers
Turnover as % of full-time teachers 14.9 16.6 17.9 13.4 19.2 16.3 15.2 17.4 16.4
Gain as % of full-time teachers 1.8 2.4 0.5 0.5 1.8 1.9 2.0 1.5 1.7
Total 13,343 23,705 11,579 4,485 6,633 37,509 21,794 26,833 48,627
Appendix Two
Comparative Tables
Tables in Appendix Two show comparative gures for the 1,360 schools that participated in the Census in
both 2022 and 2023. In each table the 2023 gures are printed in bold and the 2022 gures are printed in
italics. Figures highlighted in yellow show the percentage change between the two years. Where schools are
categorised by age, gender and by day and boarding, the categorisation is based on the school as it is in 2023;
in a small number of cases this will dier from how the school would have been categorised in 2022.
Table 1. Changes to pupil numbers by category of school
This table shows total school and pupil numbers for schools that participated in the Census in both 2022 and 2023, including a
breakdown by category of school. The girls at “single-sex: boys’” schools and the boys at “single-sex: girls’” schools are all in the nursery.
Schools Senior
Mixed-
age Junior
Single-sex:
boys'
Single-sex:
girls' Co-ed
Schools with
boarders
Day
schools Total
Number of schools 250 485 625 104 156 1,100 434 926 1,360
Pupils
Boarders (boys) 22,401 9,280 3,771 5,815 0 29,637 35,452 0 35,452
22,113 9,189 3,656 5,847 0 29,111 34,950 8 34,958
1.3% 1.0% 3.1% -0.5% 1.8% 1.4% -100.0% 1.4%
Boarders (girls) 20,162 8,491 2,220 0 7,558 23,315 30,873 0 30,873
19,513 8,532 2,003 0 7,475 22,573 30,042 6 30,048
3.3% -0.5% 10.8% 1.1% 3.3% 2.8% -100.0% 2.7%
Day pupils (boys) 43,812 119,250 79,087 40,887 210 201,052 79,142 163,007 242,149
43,269 117,168 78,819 40,713 195 198,348 77,814 161,442 239,256
1.3% 1.8% 0.3% 0.4% 7.7% 1.4% 1.7% 1.0% 1.2%
Day pupils (girls) 38,325 137,265 63,472 181 69,162 169,719 68,627 170,435 239,062
37,680 134,487 62,731 127 68,556 166,215 66,989 167,909 234,898
1.7% 2.1% 1.2% 42.5% 0.9% 2.1% 2.4% 1.5% 1.8%
Total (boys) 66,213 128,530 82,858 46,702 210 230,689 114,594 163,007 277,601
65,382 126,357 82,475 46,560 195 227,459 112,764 161,450 274,214
1.3% 1.7% 0.5% 0.3% 7.7% 1.4% 1.6% 1.0% 1.2%
Total (girls) 58,487 145,756 65,692 181 76,720 193,034 99,500 170,435 269,935
57,193 143,019 64,734 127 76,031 188,788 97,031 167,915 264,946
2.3% 1.9% 1.5% 42.5% 0.9% 2.2% 2.5% 1.5% 1.9%
Total 124,700 274,286 148,550 46,883 76,930 423,723 214,094 333,442 547,536
122,575 269,376 147,209 46,687 76,226 416,247 209,795 329,365 539,160
1.7% 1.8% 0.9% 0.4% 0.9% 1.8% 2.0% 1.2% 1.6%
43

44
Table 2. Changes to pupil
numbers by age
This table shows the number
of pupils in ISC schools that
participated in the Census in
both 2022 and 2023 by age,
gender and day/boarding.
Age
Boarders
(boys)
Day pupils
(boys)
Boarders
(girls)
Day pupils
(girls) Total
0-2 0 5,872 0 6,006 11,878
0 5,912 0 5,781 11,693
-0.7% 3.9% 1.6%
3 0 8,157 0 8,252 16,409
0 8,098 0 7,818 15,916
0.7% 5.6% 3.1%
4 0 10,499 0 10,101 20,600
1 10,280 1 10,250 20,532
-100.0% 2.1% -100.0% -1.5% 0.3%
5 0 11,002 1 10,881 21,884
0 11,058 0 10,744 21,802
-0.5% 1.3% 0.4%
6 1 11,865 1 11,535 23,402
3 11,447 2 11,611 23,063
-66.7% 3.7% -50.0% -0.7% 1.5%
7 54 13,122 64 13,165 26,405
44 13,167 50 12,589 25,850
22.7% -0.3% 28.0% 4.6% 2.1%
8 256 14,315 197 13,545 28,313
237 14,187 148 13,664 28,236
8.0% 0.9% 33.1% -0.9% 0.3%
9 507 15,379 297 14,931 31,114
427 15,635 288 15,123 31,473
18.7% -1.6% 3.1% -1.3% -1.1%
10 773 16,836 536 16,266 34,411
825 16,768 488 16,259 34,340
-6.3% 0.4% 9.8% 0.0% 0.2%
11 1,681 21,038 1,493 20,744 44,956
1,554 20,783 1,530 20,181 44,048
8.2% 1.2% -2.4% 2.8% 2.1%
12 2,028 21,293 1,991 20,935 46,247
2,080 20,627 1,964 20,012 44,683
-2.5% 3.2% 1.4% 4.6% 3.5%
13 4,144 20,159 3,375 20,116 47,794
4,225 20,591 3,394 20,452 48,662
-1.9% -2.1% -0.6% -1.6% -1.8%
14 5,119 20,790 4,303 20,955 51,167
5,058 20,324 4,118 20,156 49,656
1.2% 2.3% 4.5% 4.0% 3.0%
15 5,882 20,378 4,902 20,258 51,420
5,586 19,353 4,815 19,551 49,305
5.3% 5.3% 1.8% 3.6% 4.3%
16 6,833 15,784 6,277 15,827 44,721
6,793 15,548 6,220 15,375 43,936
0.6% 1.5% 0.9% 2.9% 1.8%
17 6,800 14,480 6,226 14,439 41,945
6,756 14,453 5,824 14,261 41,294
0.7% 0.2% 6.9% 1.2% 1.6%
18 1,217 1,016 1,088 885 4,206
1,204 864 1,056 873 3,997
1.1% 17.6% 3.0% 1.4% 5.2%
19 157 164 122 221 664
165 161 150 198 674
-4.8% 1.9% -18.7% 11.6% -1.5%
Total 35,452 242,149 30,873 239,062 547,536
34,958 239,256 30,048 234,898 539,160
1.4% 1.2% 2.7% 1.8% 1.6%

45
Table 3. Changes to pupil
numbers by year group
This table shows the number
of pupils in ISC schools that
participated in the Census in
both 2022 and 2023 by year
group, gender and day/boarding.
Year group
Boarders
(boys)
Day pupils
(boys)
Boarders
(girls)
Day pupils
(girls) Total
Nursery 0 14,164 0 14,295 28,459
0 14,078 0 13,634 27,712
0.6% 4.8% 2.7%
Reception 0 10,500 0 10,095 20,595
1 10,374 1 10,195 20,571
-100.0% 1.2% -100.0% -1.0% 0.1%
Year 1 0 11,025 1 10,871 21,897
0 11,119 0 10,858 21,977
-0.8% 0.1% -0.4%
Year 2 0 11,897 1 11,584 23,482
0 11,454 2 11,602 23,058
3.9% -50.0% -0.2% 1.8%
Year 3 53 13,120 64 13,170 26,407
44 13,205 50 12,596 25,895
20.5% -0.6% 28.0% 4.6% 2.0%
Year 4 265 14,314 199 13,523 28,301
254 14,152 153 13,690 28,249
4.3% 1.1% 30.1% -1.2% 0.2%
Year 5 512 15,421 299 14,937 31,169
435 15,640 283 15,078 31,436
17.7% -1.4% 5.7% -0.9% -0.8%
Year 6 758 16,758 514 16,204 34,234
834 16,719 477 16,252 34,282
-9.1% 0.2% 7.8% -0.3% -0.1%
Year 7 1,734 21,181 1,518 20,716 45,149
1,613 20,810 1,603 20,172 44,198
7.5% 1.8% -5.3% 2.7% 2.2%
Year 8 2,060 21,251 2,019 20,908 46,238
2,118 20,770 1,972 19,974 44,834
-2.7% 2.3% 2.4% 4.7% 3.1%
Year 9 4,344 20,286 3,464 20,155 48,249
4,408 20,579 3,522 20,558 49,067
-1.5% -1.4% -1.6% -2.0% -1.7%
Year 10 5,458 20,948 4,617 21,144 52,167
5,380 20,474 4,374 20,343 50,571
1.4% 2.3% 5.6% 3.9% 3.2%
Year 11 5,879 20,411 4,715 20,250 51,255
5,605 19,329 4,703 19,440 49,077
4.9% 5.6% 0.3% 4.2% 4.4%
Year 12 7,406 15,711 6,951 15,858 45,926
7,295 15,521 6,836 15,543 45,195
1.5% 1.2% 1.7% 2.0% 1.6%
Year 13 6,983 15,162 6,511 15,352 44,008
6,971 15,032 6,072 14,963 43,038
0.2% 0.9% 7.2% 2.6% 2.3%
Total 35,452 242,149 30,873 239,062 547,536
34,958 239,256 30,048 234,898 539,160
1.4% 1.2% 2.7% 1.8% 1.6%

46
Table 4. Changes to new pupil
numbers by year group
This table shows the number of
new pupils in ISC schools that
participated in the Census in both
2022 and 2023 by year group,
gender and day/boarding.
Year group
Boarders
(boys)
Day pupils
(boys)
Boarders
(girls)
Day pupils
(girls) Total
Nursery 0 7,037 0 7,238 14,275
0 7,193 0 7,344 14,537
-2.2% -1.4% -1.8%
Reception 0 4,228 0 4,462 8,690
0 4,501 0 4,607 9,108
-6.1% -3.1% -4.6%
Year 1 3 1,209 0 1,074 2,286
0 1,322 0 1,155 2,477
-8.5% -7.0% -7.7%
Year 2 0 1,179 1 1,114 2,294
4 1,198 1 1,122 2,325
-100.0% -1.6% 0.0% -0.7% -1.3%
Year 3 32 3,183 28 2,614 5,857
34 3,452 32 2,746 6,264
-5.9% -7.8% -12.5% -4.8% -6.5%
Year 4 197 1,863 59 1,489 3,608
169 1,925 72 1,544 3,710
16.6% -3.2% -18.1% -3.6% -2.7%
Year 5 151 1,793 90 1,654 3,688
151 1,718 104 1,709 3,682
0.0% 4.4% -13.5% -3.2% 0.2%
Year 6 240 1,541 141 1,344 3,266
260 1,612 181 1,392 3,445
-7.7% -4.4% -22.1% -3.4% -5.2%
Year 7 777 11,007 1,054 11,450 24,288
738 10,785 1,084 11,293 23,900
5.3% 2.1% -2.8% 1.4% 1.6%
Year 8 432 1,326 396 1,423 3,577
403 1,246 406 1,399 3,454
7.2% 6.4% -2.5% 1.7% 3.6%
Year 9 3,832 3,996 2,419 2,554 12,801
3,820 4,037 2,294 2,376 12,527
0.3% -1.0% 5.4% 7.5% 2.2%
Year 10 1,368 874 1,413 1,102 4,757
1,305 844 1,240 1,032 4,421
4.8% 3.6% 14.0% 6.8% 7.6%
Year 11 801 280 804 311 2,196
812 250 823 279 2,164
-1.4% 12.0% -2.3% 11.5% 1.5%
Year 12 3,054 1,883 3,300 3,099 11,336
3,042 1,813 3,471 3,019 11,345
0.4% 3.9% -4.9% 2.6% -0.1%
Year 13 543 509 558 551 2,161
475 504 473 505 1,957
14.3% 1.0% 18.0% 9.1% 10.4%
Total 11,430 41,908 10,263 41,479 105,080
11,213 42,400 10,181 41,522 105,316
1.9% -1.2% 0.8% -0.1% -0.2%

47
Table 5. Changes to pupil numbers by region
For ISC schools that participated in the Census in both 2022 and 2023, this table shows the number of pupils by region.
Please see Appendix Three, Figure 1, for denitions of regions.
Region
1
No. of
schools
Boarders
(boys)
Day pupils
(boys)
Boarders
(girls)
Day pupils
(girls)
Total
boarders
Total
day pupils
Total
pupils
London 300 1,820 53,088 626 55,519 2,446 108,607 111,053
300 1,742 52,401 642 54,548 2,384 106,949 109,333
4.5% 1.3% -2.5% 1.8% 2.6% 1.6% 1.6%
South Central 220 9,810 30,385 8,761 31,272 18,571 61,657 80,228
220 9,680 29,772 8,465 30,721 18,145 60,493 78,638
1.3% 2.1% 3.5% 1.8% 2.3% 1.9% 2.0%
South East 194 6,695 34,173 6,440 32,325 13,135 66,498 79,633
194 6,359 33,826 5,946 31,766 12,305 65,592 77,897
5.3% 1.0% 8.3% 1.8% 6.7% 1.4% 2.2%
East 151 3,074 30,088 3,041 28,381 6,115 58,469 64,584
151 3,092 29,802 3,000 27,797 6,092 57,599 63,691
-0.6% 1.0% 1.4% 2.1% 0.4% 1.5% 1.4%
West Midlands 101 2,491 16,226 2,221 15,953 4,712 32,179 36,891
101 2,414 16,044 2,144 15,832 4,558 31,876 36,434
3.2% 1.1% 3.6% 0.8% 3.4% 1.0% 1.3%
South West 91 4,231 14,224 3,872 14,371 8,103 28,595 36,698
91 4,323 13,994 3,874 13,895 8,197 27,889 36,086
-2.1% 1.6% -0.1% 3.4% -1.1% 2.5% 1.7%
North West 87 1,290 17,497 944 16,664 2,234 34,161 36,395
87 1,262 17,291 907 16,429 2,169 33,720 35,889
2.2% 1.2% 4.1% 1.4% 3.0% 1.3% 1.4%
East Midlands 69 2,323 10,446 1,550 10,551 3,873 20,997 24,870
69 2,397 10,248 1,609 10,215 4,006 20,463 24,469
-3.1% 1.9% -3.7% 3.3% -3.3% 2.6% 1.6%
Yorkshire and Humber 59 1,199 11,239 1,536 11,176 2,735 22,415 25,150
59 1,244 11,114 1,613 10,985 2,857 22,099 24,956
-3.6% 1.1% -4.8% 1.7% -4.3% 1.4% 0.8%
Scotland 34 1,326 11,461 1,061 11,714 2,387 23,175 25,562
34 1,267 11,516 1,048 11,620 2,315 23,136 25,451
4.7% -0.5% 1.2% 0.8% 3.1% 0.2% 0.4%
Wales 18 724 2,999 542 3,144 1,266 6,143 7,409
18 719 2,970 543 3,155 1,262 6,125 7,387
0.7% 1.0% -0.2% -0.3% 0.3% 0.3% 0.3%
North East 17 195 3,437 131 3,614 326 7,051 7,377
17 186 3,369 114 3,637 300 7,006 7,306
4.8% 2.0% 14.9% -0.6% 8.7% 0.6% 1.0%
All
2
1,360 35,452 242,149 30,873 239,062 66,325 481,211 547,536
1,360 34,958 239,256 30,048 234,898 65,006 474,154 539,160
1.4% 1.2% 2.7% 1.8% 2.0% 1.5% 1.6%
1
Northern Ireland, the Channel Islands and the Isle of Man are not listed due to the small number of schools in these regions.
2
The total includes data for schools in Northern Ireland, the Channel Islands and the Isle of Man.

48
Table 7. Changes to fees by school
type and age group
For ISC schools that participated in
the Census in both 2022 and 2023,
this table shows average termly fees
for dierent age groups.
Table 6. Changes to fees by region
For ISC schools that participated in the
Census in both 2022 and 2023, this
table shows the average termly fees
by region. Please see Appendix Three,
Figure 1, for denitions of regions.
1
Northern Ireland, the Channel Islands and the Isle
of Man are not listed due to the small number of
schools in these regions.
2
The total includes data for schools in Northern
Ireland, the Channel Islands and the Isle of Man.
Region
1
Boarding fee
Day fee
(boarding schools)
Day fee
(day schools)
London £14,692 £8,238 £6,625
£14,025 £7,955 £6,239
4.8% 3.6% 6.2%
South Central £13,595 £7,574 £5,555
£12,963 £7,276 £5,248
4.9% 4.1% 5.8%
South East £13,340 £8,003 £5,973
£12,677 £7,610 £5,672
5.2% 5.2% 5.3%
East £12,265 £7,207 £5,684
£11,585 £6,992 £5,381
5.9% 3.1% 5.6%
West Midlands £13,191 £6,374 £4,623
£12,560 £6,102 £4,371
5.0% 4.5% 5.8%
South West £12,922 £6,783 £4,859
£12,303 £6,480 £4,615
5.0% 4.7% 5.3%
North West £11,329 £5,647 £4,070
£10,704 £5,339 £3,862
5.8% 5.8% 5.4%
East Midlands £13,021 £7,806 £4,876
£12,161 £7,333 £4,654
7.1% 6.5% 4.8%
Yorkshire and Humber £8,125 £5,156 £4,562
£8,230 £4,810 £4,309
-1.3% 7.2% 5.9%
Scotland £12,659 £7,477 £4,672
£12,034 £7,045 £4,379
5.2% 6.1% 6.7%
Wales £13,523 £5,204 £4,537
£12,741 £4,896 £4,308
6.1% 6.3% 5.3%
North East £9,524 £5,009 £4,660
£9,226 £4,741 £4,400
3.2% 5.7% 5.9%
All
2
£12,996 £7,196 £5,446
£12,358 £6,877 £5,147
5.2% 4.6% 5.8%
Age group Boarding fee
Day fee
(boarding schools)
Day fee
(day schools)
Sixth form £13,670 £8,146 £5,995
£12,971 £7,724 £5,653
5.4% 5.5% 6.0%
Senior £12,780 £7,636 £5,844
£12,157 £7,306 £5,528
5.1% 4.5% 5.7%
Junior £9,320 £5,833 £5,096
£8,951 £5,600 £4,825
4.1% 4.1% 5.6%
Nursery £3,595 £4,083
£3,461 £3,836
3.9% 6.4%
Overall including nursery £12,996 £7,196 £5,446
£12,358 £6,877 £5,147
5.2% 4.6% 5.8%

49
Table 8a. Changes to contributions to fees: senior, mixed-age and junior schools (termly values)
For ISC schools that participated in the Census in both 2022 and 2023, this table shows the breakdown of contributions to fees by
type of contribution.
Senior
(pupils)
Senior
(value £m)
Mixed-age
(pupils)
Mixed-age
(value £m)
Junior
(pupils)
Junior
(value £m)
Total
(pupils)
Total
(value £m)
% of all
pupils
The school
42,803 129.3 84,670 161.1 31,204 42.3 158,677 332.7 29.0
43,410 127.5 82,441 151.1 31,051 40.6 156,902 319.2 29.1
-1.4% 1.4% 2.7% 6.6% 0.5% 4.2% 1.1% 4.2% -0.4%
The school: means-tested: bursaries
12,347 66.3 21,129 72.9 5,501 13.8 38,977 153.1 7.1
12,738 62.4 21,121 67.9 5,859 13.5 39,718 143.7 7.4
-3.1% 6.3% 0.0% 7.4% -6.1% 2.8% -1.9% 6.5% -3.4%
The school: means-tested: scholarships
819 3.5 1,120 2.2 167 0.3 2,106 5.9 0.4
1,188 6.4 1,880 2.7 159 0.3 3,227 9.4 0.6
-31.1% -45.9% -40.4% -20.3% 5.0% -8.7% -34.7% -37.3% -35.7%
The school: means-tested: eligible families
1
327 0.9 1,551 2.2 630 0.9 2,508 3.9 0.5
879 2.4 1,292 1.5 937 1.4 3,108 5.3 0.6
-62.8% -64.4% 20.0% 47.6% -32.8% -38.5% -19.3% -26.1% -20.5%
The school: non-means-tested: scholarships
23,533 29.7 34,260 35.6 2,824 2.9 60,617 68.2 11.1
23,176 29.4 32,498 33.5 2,860 2.7 58,534 65.6 10.9
1.5% 0.8% 5.4% 6.3% -1.3% 7.8% 3.6% 3.9% 2.0%
The school: non-means-tested: eligible families
1
12,207 29.0 38,989 48.1 23,676 24.0 74,872 101.2 13.7
12,367 26.8 37,614 45.4 23,063 22.3 73,044 94.6 13.5
-1.3% 8.1% 3.7% 5.9% 2.7% 7.6% 2.5% 6.9% 0.9%
The school: itrust
2
0 0.00 6 0.01 56 0.40 62 0.42 0.01
0 0.00 4 0.00 59 0.41 63 0.41 0.01
50.0% 172.1% -5.1% -1.3% -1.6% 0.7% -3.1%
Early Years Funding
0 0.0 6,722 7.0 15,473 13.9 22,195 20.9 4.1
0 0.0 6,648 6.7 14,987 13.2 21,635 19.9 4.0
1.1% 4.3% 3.2% 5.2% 2.6% 4.9% 1.0%
Local Authorities
3
894 9.7 3,321 27.1 179 0.7 4,394 37.5 0.8
889 8.4 3,058 24.6 218 0.8 4,165 33.8 0.8
0.6% 16.3% 8.6% 9.8% -17.9% -11.2% 5.5% 11.0% 3.9%
Government Music and Dance Scheme
811 5.8 692 5.6 49 0.2 1,552 11.6 0.3
808 6.1 697 5.6 65 0.3 1,570 12.0 0.3
0.4% -5.3% -0.7% -0.3% -24.6% -11.4% -1.1% -3.1% -2.7%
All other sources
663 2.5 745 2.0 387 1.1 1,795 5.6 0.3
757 2.6 822 2.0 385 1.1 1,964 5.6 0.4
-12.4% -3.7% -9.4% 1.3% 0.5% 3.5% -8.6% -0.5% -10.0%
Total
44,052 147.3 93,292 202.8 44,160 58.2 181,504 408.2 33.9
44,569 144.5 90,947 190.0 43,775 55.9 179,291 390.4 34.0
-1.2% 1.9% 2.6% 6.7% 0.9% 4.1% 1.2% 4.6% -0.3%
Number of pupils as a % of all pupils
36.3 35.0 29.9 33.9
37.4 34.7 29.9 34.0
-2.9% 0.7% 0.0% -0.3%
1
Includes HM Forces discounts, sta discounts, sibling discounts and clergy discounts.
2
itrust is an IAPS charity supporting low-income families and families with short-term nancial diculties.
3
Excludes data for schools in Northern Ireland, the Channel Islands and the Isle of Man.

50
Table 8b. Changes to contributions to fees: single-sex and co-educational schools (termly values)
For ISC schools that participated in the Census in both 2022 and 2023, this table shows the breakdown of contributions to fees by
type of contribution.
Single-sex:
boys'
(pupils)
Single-sex:
boys'
(value £m)
Single-sex:
girls'
(pupils)
Single-sex:
girls'
(value £m)
Co-ed
(pupils)
Co-ed
(value £m)
Total
(pupils)
Total
(value £m) % of all pupils
The school
8,277 24.5 19,509 43.7 130,891 264.5 158,677 332.7 29.0
8,589 25.2 19,570 40.8 128,743 253.2 156,902 319.2 29.1
-3.6% -2.8% -0.3% 7.2% 1.7% 4.5% 1.1% 4.2% -0.4%
The school: means-tested: bursaries
2,974 15.2 5,589 25.2 30,414 112.7 38,977 153.1 7.1
3,037 14.5 5,700 23.5 30,981 105.7 39,718 143.7 7.4
-2.1% 4.4% -1.9% 7.4% -1.8% 6.6% -1.9% 6.5% -3.4%
The school: means-tested: scholarships
169 1.0 177 0.6 1,760 4.3 2,106 5.9 0.4
165 0.9 159 0.6 2,903 7.9 3,227 9.4 0.6
2.4% 6.9% 11.3% 1.2% -39.4% -45.5% -34.7% -37.3% -35.7%
The school: means-tested: eligible families
1
31 0.1 394 0.5 2,083 3.3 2,508 3.9 0.5
392 1.6 444 0.8 2,272 2.9 3,108 5.3 0.6
-92.1% -92.3% -11.3% -35.1% -8.3% 14.0% -19.3% -26.1% -20.5%
The school: non-means-tested: scholarships
3,536 3.7 10,095 9.2 46,986 55.2 60,617 68.2 11.1
3,706 3.9 10,046 8.8 44,782 52.9 58,534 65.6 10.9
-4.6% -4.0% 0.5% 4.6% 4.9% 4.4% 3.6% 3.9% 2.0%
The school: non-means-tested: eligible families
1
2,129 4.1 5,832 8.1 66,911 89.0 74,872 101.2 13.7
2,157 3.9 5,947 7.0 64,940 83.7 73,044 94.6 13.5
-1.3% 7.0% -1.9% 14.9% 3.0% 6.3% 2.5% 6.9% 0.9%
The school: itrust
2
28 0.36 2 0.00 32 0.05 62 0.42 0.01
30 0.36 2 0.00 31 0.05 63 0.41 0.01
-6.7% -1.2% 0.0% 3.9% 3.2% 15.3% -1.6% 0.7% -3.1%
Early Years Funding
485 0.4 1,316 1.2 20,394 19.3 22,195 20.9 4.1
643 0.6 1,106 1.0 19,886 18.4 21,635 19.9 4.0
-24.6% -24.9% 19.0% 23.9% 2.6% 4.8% 2.6% 4.9% 1.0%
Local Authorities
3
422 2.7 50 0.3 3,922 34.5 4,394 37.5 0.8
397 2.4 67 0.3 3,701 31.1 4,165 33.8 0.8
6.3% 13.0% -25.4% -0.8% 6.0% 10.9% 5.5% 11.0% 3.9%
Government Music and Dance Scheme
10 0.0 3 0.0 1,539 11.6 1,552 11.6 0.3
10 0.0 1 0.0 1,559 12.0 1,570 12.0 0.3
0.0% 3.5% 200.0% 9.3% -1.3% -3.1% -1.1% -3.1% -2.7%
All other sources
189 0.8 201 0.6 1,405 4.2 1,795 5.6 0.3
163 0.6 225 0.7 1,576 4.4 1,964 5.6 0.4
16.0% 34.7% -10.7% -17.5% -10.9% -2.8% -8.6% -0.5% -10.0%
Total
8,791 28.4 20,653 45.7 152,060 334.1 181,504 408.2 33.9
9,346 28.8 20,671 42.6 149,274 319.0 179,291 390.4 34.0
-5.9% -1.1% -0.1% 7.1% 1.9% 4.7% 1.2% 4.6% -0.3%
Number of pupils as a % of all pupils
20.2 27.3 36.5 33.9
21.6 27.6 36.5 34.0
-6.4% -1.0% 0.1% -0.3%
1
Includes HM Forces discounts, sta discounts, sibling discounts and clergy discounts.
2
itrust is an IAPS charity supporting low-income families and families with short-term nancial diculties.
3
Excludes data for schools in Northern Ireland, the Channel Islands and the Isle of Man.

51
Table 8c. Changes to contributions to fees: day and boarding schools (termly values)
For ISC schools that participated in the Census in both 2022 and 2023, this table shows the breakdown of contributions to fees by
type of contribution.
Schools with
boarders (pupils)
Schools with
boarders
(value £m)
Day schools
(pupils)
Day schools
(value £m)
Total
(pupils)
Total
(value £m) % of all pupils
The school
78,762 203.3 79,915 129.4 158,677 332.7 29.0
78,445 199.1 78,457 120.1 156,902 319.2 29.1
0.4% 2.1% 1.9% 7.8% 1.1% 4.2% -0.4%
The school: means-tested: bursaries
20,021 90.0 18,956 63.1 38,977 153.1 7.1
20,618 84.7 19,100 59.0 39,718 143.7 7.4
-2.9% 6.2% -0.8% 6.9% -1.9% 6.5% -3.4%
The school: means-tested: scholarships
1,162 4.3 944 1.6 2,106 5.9 0.4
2,141 7.6 1,086 1.8 3,227 9.4 0.6
-45.7% -43.4% -13.1% -12.0% -34.7% -37.3% -35.7%
The school: means-tested: eligible families
1
1,087 2.2 1,421 1.7 2,508 3.9 0.5
1,153 3.2 1,955 2.2 3,108 5.3 0.6
-5.7% -30.1% -27.3% -20.2% -19.3% -26.1% -20.5%
The school: non-means-tested: scholarships
34,695 45.1 25,922 23.1 60,617 68.2 11.1
33,840 44.0 24,694 21.6 58,534 65.6 10.9
2.5% 2.4% 5.0% 6.8% 3.6% 3.9% 2.0%
The school: non-means-tested: eligible families
1
34,577 61.3 40,295 39.9 74,872 101.2 13.7
34,370 59.2 38,674 35.5 73,044 94.6 13.5
0.6% 3.6% 4.2% 12.4% 2.5% 6.9% 0.9%
The school: itrust
2
45 0.38 17 0.04 62 0.42 0.01
44 0.38 19 0.03 63 0.41 0.01
2.3% -0.8% -10.5% 20.0% -1.6% 0.7% -3.1%
Early Years Funding
4,176 3.6 18,019 17.3 22,195 20.9 4.1
4,078 3.6 17,557 16.3 21,635 19.9 4.0
2.4% -0.7% 2.6% 6.1% 2.6% 4.9% 1.0%
Local Authorities
3
1,230 8.8 3,164 28.7 4,394 37.5 0.8
1,175 8.4 2,990 25.4 4,165 33.8 0.8
4.7% 4.8% 5.8% 13.0% 5.5% 11.0% 3.9%
Government Music and Dance Scheme
1,552 11.6 0 0.0 1,552 11.6 0.3
1,561 11.9 9 0.0 1,570 12.0 0.3
-0.6% -2.8% -100.0% -100.0% -1.1% -3.1% -2.7%
All other sources
884 3.6 911 2.0 1,795 5.6 0.3
1,037 3.5 927 2.1 1,964 5.6 0.4
-14.8% 2.9% -1.7% -6.1% -8.6% -0.5% -10.0%
Total
84,066 230.9 97,438 177.4 181,504 408.2 33.9
83,622 226.5 95,669 163.9 179,291 390.4 34.0
0.5% 1.9% 1.8% 8.2% 1.2% 4.6% -0.3%
Number of pupils as a % of all pupils
39.9 30.0 33.9
40.5 29.8 34.0
-1.5% 0.6% -0.3%
1
Includes HM Forces discounts, sta discounts, sibling discounts and clergy discounts.
2
itrust is an IAPS charity supporting low-income families and families with short-term nancial diculties.
3
Excludes data for schools in Northern Ireland, the Channel Islands and the Isle of Man.

52
Table 9. Changes to
non-British pupils whose
parents live overseas
For ISC schools that participated
in the Census in both 2022
and 2023, this table shows the
number of non-British pupils
whose parents live overseas
broken down by country/area
of residence.
Senior Mixed-age Junior
Single-sex:
boys'
Single-sex:
girls' Co-ed
Schools
with boarders
Day
schools Total
France 198 159 46 19 20 364 395 8 403
188 137 53 26 22 330 361 17 378
5.3% 16.1% -13.2% -26.9% -9.1% 10.3% 9.4% -52.9% 6.6%
Germany 988 1,099 12 35 60 2,004 2,090 9 2,099
941 1,099 12 33 54 1,965 2,048 4 2,052
5.0% 0.0% 0.0% 6.1% 11.1% 2.0% 2.1% 125.0% 2.3%
Russia 741 278 37 25 32 999 1,029 27 1,056
854 338 48 41 43 1,156 1,219 21 1,240
-13.2% -17.8% -22.9% -39.0% -25.6% -13.6% -15.6% 28.6% -14.8%
Spain 554 606 304 89 146 1,229 1,425 39 1,464
530 529 297 79 138 1,139 1,325 31 1,356
4.5% 14.6% 2.4% 12.7% 5.8% 7.9% 7.5% 25.8% 8.0%
Ireland 30 33 1 7 2 55 58 6 64
25 36 2 8 3 52 62 1 63
20.0% -8.3% -50.0% -12.5% -33.3% 5.8% -6.5% 500.0% 1.6%
Italy 289 119 6 2 12 400 409 5 414
300 148 7 5 10 440 453 2 455
-3.7% -19.6% -14.3% -60.0% 20.0% -9.1% -9.7% 150.0% -9.0%
Poland 57 47 4 2 8 98 107 1 108
65 38 2 2 9 94 104 1 105
-12.3% 23.7% 100.0% 0.0% -11.1% 4.3% 2.9% 0.0% 2.9%
Romania 85 25 3 1 6 106 112 1 113
92 23 2 2 7 108 116 1 117
-7.6% 8.7% 50.0% -50.0% -14.3% -1.9% -3.4% 0.0% -3.4%
Remainder of Europe (EEA) 777 526 30 40 90 1,203 1,307 26 1,333
716 463 36 36 64 1,115 1,195 20 1,215
8.5% 13.6% -16.7% 11.1% 40.6% 7.9% 9.4% 30.0% 9.7%
Remainder of Europe (non-EEA) 920 496 52 26 49 1,393 1,392 76 1,468
667 310 14 15 35 941 976 15 991
37.9% 60.0% 271.4% 73.3% 40.0% 48.0% 42.6% 406.7% 48.1%
Nigeria 566 246 34 21 90 735 788 58 846
579 218 49 28 113 705 799 47 846
-2.2% 12.8% -30.6% -25.0% -20.4% 4.3% -1.4% 23.4% 0.0%
Rest of Africa 370 272 15 12 48 597 625 32 657
411 222 21 10 51 593 624 30 654
-10.0% 22.5% -28.6% 20.0% -5.9% 0.7% 0.2% 6.7% 0.5%
USA 190 134 30 19 46 289 347 7 354
182 147 28 23 38 296 345 12 357
4.4% -8.8% 7.1% -17.4% 21.1% -2.4% 0.6% -41.7% -0.8%
Rest of North America 100 47 4 3 9 139 148 3 151
64 29 9 9 9 84 98 4 102
56.3% 62.1% -55.6% -66.7%
0.0% 65.5% 51.0% -25.0% 48.0%
Central and South America 268 223 7 11 45 442 492 6 498
340 267 9 17 68 531 605 11 616
-21.2% -16.5% -22.2% -35.3% -33.8% -16.8% -18.7% -45.5% -19.2%
Middle East 426 165 13 18 30 556 573 31 604
443 155 18 24 33 559 584 32 616
-3.8% 6.5% -27.8% -25.0% -9.1% -0.5% -1.9% -3.1% -1.9%
Hong Kong 3,326 2,191 137 390 1,000 4,264 5,549 105 5,654
3,322 2,348 163 411 992 4,430 5,730 103 5,833
0.1% -6.7% -16.0% -5.1% 0.8% -3.7% -3.2% 1.9% -3.1%
Mainland China 2,905 1,568 210 227 655 3,801 4,521 162 4,683
2,948 1,675 235 225 659 3,974 4,660 198 4,858
-1.5% -6.4% -10.6% 0.9% -0.6% -4.4% -3.0% -18.2% -3.6%
Taiwan 67 38 10 2 10 103 110 5 115
82 37 4 2 10 111 113 10 123
-18.3% 2.7% 150.0% 0.0% 0.0% -7.2% -2.7% -50.0% -6.5%
Japan 287 133 57 38 29 410 472 5 477
265 121 61 35 27 385 441 6 447
8.3% 9.9% -6.6% 8.6% 7.4% 6.5% 7.0% -16.7% 6.7%
South Korea 272 80 26 23 43 312 355 23 378
236 48 21 21 46 238 289 16 305
15.3% 66.7% 23.8% 9.5% -6.5% 31.1% 22.8% 43.8% 23.9%
Malaysia 237 39 1 15 20 242 270 7 277
219 38 2 17 28 214 254 5 259
8.2% 2.6% -50.0% -11.8% -28.6% 13.1% 6.3% 40.0% 6.9%
Thailand 467 200 40 39 86 582 699 8 707
456 166 35 38 85 534 614 43 657
2.4% 20.5% 14.3% 2.6% 1.2% 9.0% 13.8% -81.4% 7.6%
India 145 74 12 13 15 203 218 13 231
134 78 12 13 19 192 209 15 224
8.2% -5.1% 0.0% 0.0% -21.1% 5.7% 4.3% -13.3% 3.1%
Pakistan, Sri Lanka and Bangladesh 43 27 5 1 9 65 69 6 75
43 20 4 1 6 60 59 8 67
0.0% 35.0% 25.0% 0.0% 50.0% 8.3% 16.9% -25.0% 11.9%
Central Asia 233 73 6 1 9 302 297 15 312
231 67 3 7 7 287 287 14 301
0.9% 9.0% 100.0% -85.7% 28.6% 5.2% 3.5% 7.1% 3.7%
Remainder of Far East 595 193 22 37 76 697 735 75 810
515 135 14 22 61 581 642 22 664
15.5% 43.0% 57.1% 68.2% 24.6% 20.0% 14.5% 240.9% 22.0%
Oceania 65 23 6 9 12 73 91 3 94
52 28 5 3 12 70 81 4 85
25.0% -17.9% 20.0% 200.0% 0.0% 4.3% 12.3% -25.0% 10.6%
Total 15,201 9,114
1,130 1,125 2,657 21,663 24,683 762 25,445
14,900 8,920 1,166 1,153 2,649 21,184 24,293 693 24,986
2.0% 2.2% -3.1% -2.4% 0.3% 2.3% 1.6% 10.0% 1.8%

Table 10. Changes to
non-British pupils whose
parents live in the UK
For ISC schools that participated
in the Census in both 2022
and 2023, this table shows the
number of non-British pupils
whose parents live in the UK
broken down by country/area
of nationality.
Senior Mixed-age Junior
Single-sex:
boys'
Single-sex:
girls' Co-ed
Schools with
boarders
Day
schools Total
France 409 1,842 542 218 317 2,258 600 2,193 2,793
448 1,835 519 236 350 2,216 660 2,142 2,802
-8.7% 0.4% 4.4% -7.6% -9.4% 1.9% -9.1% 2.4% -0.3%
Germany 286 604 311 160 243 798 475 726 1,201
276 566 328 153 256 761 445 725 1,170
3.6% 6.7% -5.2% 4.6% -5.1% 4.9% 6.7% 0.1% 2.6%
Russia 252 333 339 114 148 662 412 512 924
245 362 326 140 148 645 398 535 933
2.9% -8.0% 4.0% -18.6% 0.0% 2.6% 3.5% -4.3% -1.0%
Spain 221 810 248 117 196 966 340 939 1,279
235 809 242 113 195 978 301 985 1,286
-6.0% 0.1% 2.5% 3.5% 0.5% -1.2% 13.0% -4.7% -0.5%
Ireland 413 661 247 136 303 882 539 782 1,321
444 669 252 136 277 952 629 736 1,365
-7.0% -1.2% -2.0% 0.0% 9.4% -7.4% -14.3% 6.3% -3.2%
Italy 374 636 355 194 270 901 420 945 1,365
416 645 344 208 283 914 434 971 1,405
-10.1% -1.4% 3.2% -6.7% -4.6% -1.4% -3.2% -2.7% -2.8%
Poland 108 221 83 28 73 311 158 254 412
102 201 71 28 66 280 146 228 374
5.9% 10.0% 16.9% 0.0% 10.6% 11.1% 8.2% 11.4% 10.2%
Romania 80 132 87 16 32 251 109 190 299
69 136 76 19 35 227 99 182 281
15.9% -2.9% 14.5% -15.8% -8.6% 10.6% 10.1% 4.4% 6.4%
Remainder of Europe (EEA) 1,064 1,925 1,042 449 719 2,863 1,501 2,530 4,031
1,131 1,863 1,045 475 698 2,866 1,603 2,436 4,039
-5.9% 3.3% -0.3% -5.5% 3.0% -0.1% -6.4% 3.9% -0.2%
Remainder of Europe (non-EEA) 566 959 578 140 330 1,633 962 1,141 2,103
213 363 249 90 111 624 341 484 825
165.7% 164.2% 132.1% 55.6% 197.3% 161.7% 182.1% 135.7% 154.9%
Nigeria 166 387 130 50 102 531 339 344 683
161 298 116 44 92 439 330 245 575
3.1% 29.9% 12.1% 13.6% 10.9% 21.0% 2.7% 40.4% 18.8%
Rest of Africa 233 677 308 66 193 959 522 696 1,218
228 546 248 58 143 821 441 581 1,022
2.2% 24.0% 24.2% 13.8% 35.0% 16.8% 18.4% 19.8% 19.2%
USA 616 2,000 1,226 312 499 3,031 1,703 2,139 3,842
568 1,913 1,192 294 474 2,905 1,621 2,052 3,673
8.5% 4.5% 2.9% 6.1% 5.3% 4.3% 5.1% 4.2% 4.6%
Rest of North America 105 283 164 49 91 412 219 333 552
98 240 123 51 74 336 167 294 461
7.1% 17.9% 33.3% -3.9%
23.0% 22.6% 31.1% 13.3% 19.7%
Central and South America 103 280 172 28 64 463 217 338 555
99 249 135 34 54 395 162 321 483
4.0% 12.4% 27.4% -17.6% 18.5% 17.2% 34.0% 5.3% 14.9%
Middle East 149 832 250 51 94 1,086 186 1,045 1,231
137 720 223 52 74 954 166 914 1,080
8.8% 15.6% 12.1% -1.9% 27.0% 13.8% 12.0% 14.3% 14.0%
Hong Kong 759 1,309 288 231 551 1,574 1,433 923 2,356
446 840 242 144 331 1,053 916 612 1,528
70.2% 55.8% 19.0% 60.4% 66.5% 49.5% 56.4% 50.8% 54.2%
Mainland China 937 1,889 1,190 604 902 2,510 1,924 2,092 4,016
682 1,458 925 478 756 1,831 1,410 1,655 3,065
37.4% 29.6% 28.6% 26.4% 19.3% 37.1% 36.5% 26.4% 31.0%
Taiwan 8 18 15 5 7 29 15 26 41
7 15 13 2 5 28 17 18 35
14.3% 20.0% 15.4% 150.0% 40.0% 3.6% -11.8% 44.4% 17.1%
Japan 108 259 266 53 109 471 169 464 633
109 233 251 45 110 438 155 438 593
-0.9% 11.2% 6.0% 17.8% -0.9% 7.5% 9.0% 5.9% 6.7%
South Korea 131 208 141 48 135 297 175 305 480
107 175 125 52 130 225 150 257 407
22.4% 18.9% 12.8% -7.7% 3.8% 32.0% 16.7% 18.7% 17.9%
Malaysia 40 83 47 25 41 104 61 109 170
40 72 43 25 41 89 59 96 155
0.0% 15.3% 9.3% 0.0% 0.0% 16.9% 3.4% 13.5% 9.7%
Thailand 25 34 16 3 11 61 50 25 75
21 32 18 3 8 60 50 21 71
19.0% 6.3% -11.1% 0.0% 37.5% 1.7% 0.0% 19.0% 5.6%
India 209 1,010 445 205 427 1,032 330 1,334 1,664
183 782 407 169 344 859 281 1,091 1,372
14.2% 29.2% 9.3% 21.3% 24.1% 20.1% 17.4% 22.3% 21.3%
Pakistan, Sri Lanka and Bangladesh 99 277 63 53 126 260 80 359 439
90 252 79 56 101 264 83 338 421
10.0% 9.9% -20.3% -5.4% 24.8% -1.5% -3.6% 6.2% 4.3%
Central Asia 62 87 51 6 28 166 93 107 200
46 65 45 13 25 118 61 95 156
34.8% 33.8% 13.3% -53.8% 12.0% 40.7% 52.5% 12.6% 28.2%
Remainder of Far East 78 137 89 36 60 208 128 176 304
99 130 86 20 72 223 158 157 315
-21.2% 5.4% 3.5% 80.0% -16.7% -6.7% -19.0% 12.1% -3.5%
Oceania 215 419 302 81 159 696 402 534 936
217 353 237 70 139 598 372 435 807
-0.9% 18.7% 27.4% 15.7% 14.4% 16.4% 8.1% 22.8% 16.0%
Total 7,816 18,312
8,995 3,478 6,230 25,415 13,562 21,561 35,123
6,917 15,822 7,960 3,208 5,392 22,099 11,655 19,044 30,699
13.0% 15.7% 13.0% 8.4% 15.5% 15.0% 16.4% 13.2% 14.4%
53

54
Table 12. Changes to teacher numbers
1
This table shows the number of teachers in ISC schools that participated in the Census in 2022 and 2023.
Table 11. Changes to British pupils whose parents live overseas
For ISC schools that participated in the Census in both 2022 and 2023, this table shows the number of British pupils whose parents
live overseas and the number of British pupils whose parents serve in HM Forces and those who are new to their school this year.
British pupils whose
parents: Senior Mixed-age Junior
Single-sex:
boys'
Single-sex:
girls' Co-ed
Schools
with
boarders Day schools Total
Live abroad 2,264 1,001 177 266 469 2,707 3,298 144 3,442
2,309 1,022 164 355 468 2,672 3,317 178 3,495
-1.9% -2.1% 7.9% -25.1% 0.2% 1.3% -0.6% -19.1% -1.5%
Serve in HM Forces 1,418 1,850 1,302 126 266 4,178 3,995 575 4,570
1,376 1,885 1,277 163 254 4,121 3,977 561 4,538
3.1% -1.9% 2.0% -22.7% 4.7% 1.4% 0.5% 2.5% 0.7%
New British pupils whose parents:
Live abroad 661 316 78 41 118 896 1,017 38 1,055
755 298 45 93 123 882 1,042 56 1,098
-12.5% 6.0% 73.3% -55.9% -4.1% 1.6% -2.4% -32.1% -3.9%
Serve in HM Forces 235 245 275 18 35 702 653 102 755
205 324 274 33 34 736 711 92 803
14.6% -24.4% 0.4% -45.5% 2.9% -4.6% -8.2% 10.9% -6.0%
Full-time Senior Mixed-age Junior
Single-sex:
boys'
Single-sex:
girls' Co-ed
Schools
with
boarders Day schools Total
Men 6,861 9,371 3,458 2,642 1,687 15,361 10,361 9,329 19,690
6,897 9,133 3,448 2,639 1,624 15,215 10,280 9,198 19,478
-0.5% 2.6% 0.3% 0.1% 3.9% 1.0% 0.8% 1.4% 1.1%
Women 6,372 13,902 8,017 1,824 4,809 21,658 11,433 16,858 28,291
6,140 13,679 8,035 1,766 4,768 21,320 11,176 16,678 27,854
3.8% 1.6% -0.2% 3.3% 0.9% 1.6% 2.3% 1.1% 1.6%
Total 13,233 23,273 11,475 4,466 6,496 37,019 21,794 26,187 47,981
13,037 22,812 11,483 4,405 6,392 36,535 21,456 25,876 47,332
1.5% 2.0% -0.1% 1.4% 1.6% 1.3% 1.6% 1.2% 1.4%
Part-time
Men 1,166 1,545 538 356 434 2,459 1,524 1,725 3,249
1,192 1,434 567 350 413 2,430 1,534 1,659 3,193
-2.2% 7.7% -5.1% 1.7% 5.1% 1.2% -0.7% 4.0% 1.8%
Women 3,223 7,265 3,669 697 3,059 10,401 5,352 8,805 14,157
3,272 7,098 3,553 657 3,007 10,259 5,318 8,605 13,923
-1.5% 2.4% 3.3% 6.1% 1.7% 1.4% 0.6% 2.3% 1.7%
Total 4,389 8,810 4,207 1,053 3,493 12,860 6,876 10,530 17,406
4,464 8,532 4,120 1,007 3,420 12,689 6,852 10,264 17,116
-1.7% 3.3% 2.1% 4.6% 2.1% 1.3% 0.4% 2.6% 1.7%
Part-time (hours)
Men 20,461 28,120 9,760 6,031 8,055 44,256 27,051 31,291 58,342
19,512 26,276 9,743 6,298 7,530 41,703 26,051 29,480 55,530
4.9% 7.0% 0.2% -4.2% 7.0% 6.1% 3.8% 6.1% 5.1%
Women 60,348 147,240 72,980 13,776 58,595 208,197 104,201 176,366 280,567
59,699 141,940 69,534 13,843 57,879 199,450 100,990 170,182 271,172
1.1% 3.7% 5.0% -0.5% 1.2% 4.4% 3.2% 3.6% 3.5%
Total 80,809 175,360 82,740 19,807 66,649 252,453 131,252 207,658 338,909
79,211 168,216 79,276 20,141 65,409 241,153 127,041 199,661 326,702
2.0% 4.2% 4.4% -1.7% 1.9% 4.7% 3.3% 4.0% 3.7%
Overall full-time equivalent (32.5 hours = 1 full-time)
Men 7,491 10,236 3,758 2,828 1,935 16,723 11,193 10,292 21,485
7,497 9,941 3,748 2,833 1,856 16,498 11,082 10,105 21,187
-0.1% 3.0% 0.3% -0.2% 4.3% 1.4% 1.0% 1.8% 1.4%
Women 8,229 18,432 10,263 2,248 6,612 28,064 14,639 22,285 36,924
7,977 18,046 10,174 2,192 6,549 27,457 14,283 21,914 36,198
3.2% 2.1% 0.9% 2.6% 1.0% 2.2% 2.5% 1.7% 2.0%
Total 15,719 28,669 14,021 5,075 8,547 44,787 25,833 32,576 58,409
15,474 27,988 13,922 5,025 8,405 43,955 25,365 32,019 57,384
1.6% 2.4% 0.7% 1.0% 1.7% 1.9% 1.8% 1.7% 1.8%
1
Excludes nursery sta.

55
Table 13. Changes to teaching assistant numbers
1
This table shows the number of teaching assistants in ISC schools that participated in the Census in 2022 and 2023.
Full-time Senior Mixed-age Junior
Single-sex:
boys'
Single-sex:
girls' Co-ed
Schools
with boarders Day schools Total
Men 133 418 368 113 40 766 314 605 919
147 366 407 107 24 789 303 617 920
-9.5% 14.2% -9.6% 5.6% 66.7% -2.9% 3.6% -1.9% -0.1%
Women 363 2,574 3,440 431 605 5,341 1,496 4,881 6,377
310 2,360 3,285 384 573 4,998 1,390 4,565 5,955
17.1% 9.1% 4.7% 12.2% 5.6% 6.9% 7.6% 6.9% 7.1%
Total 496 2,992 3,808 544 645 6,107 1,810 5,486 7,296
457 2,726 3,692 491 597 5,787 1,693 5,182 6,875
8.5% 9.8% 3.1% 10.8% 8.0% 5.5% 6.9% 5.9% 6.1%
Part-time
Men 60 161 114 29 24 282 115 220 335
64 137 118 36 25 258 106 213 319
-6.3% 17.5% -3.4% -19.4% -4.0% 9.3% 8.5% 3.3% 5.0%
Women 382 2,296 2,497 250 600 4,325 1,560 3,615 5,175
376 2,182 2,364 254 571 4,097 1,444 3,478 4,922
1.6% 5.2% 5.6% -1.6% 5.1% 5.6% 8.0% 3.9% 5.1%
Total 442 2,457 2,611 279 624 4,607 1,675 3,835 5,510
440 2,319 2,482 290 596 4,355 1,550 3,691 5,241
0.5% 6.0% 5.2% -3.8% 4.7% 5.8% 8.1% 3.9% 5.1%
Part-time hours
Men 860 2,967 2,194 611 358 5,051 2,118 3,903 6,020
973 2,538 2,261 681 492 4,598 1,811 3,960 5,771
-11.6% 16.9% -3.0% -10.3% -27.3% 9.9% 16.9% -1.4% 4.3%
Women 6,097 48,667 52,258 5,360 11,410 90,253 31,481 75,542 107,023
6,548 44,873 49,120 5,260 11,138 84,142 28,598 71,943 100,541
-6.9% 8.5% 6.4% 1.9% 2.4% 7.3% 10.1% 5.0% 6.4%
Total 6,957 51,634 54,452 5,971 11,768 95,304 33,599 79,444 113,043
7,521 47,411 51,380 5,941 11,630 88,740 30,409 75,903 106,312
-7.5% 8.9% 6.0% 0.5% 1.2% 7.4% 10.5% 4.7% 6.3%
Overall full-time equivalent (32.5 hours = 1 full-time)
Men 159 509 435 132 51 921 379 725 1,104
177 444 477 128 39 930 359 739 1,098
-9.9% 14.7% -8.6% 3.0% 30.3% -1.0% 5.7% -1.9% 0.6%
Women 551 4,071 5,048 596 956 8,118 2,465 7,205 9,670
511 3,741 4,796 546 916 7,587 2,270 6,779 9,049
7.6% 8.8% 5.2% 9.2% 4.4% 7.0% 8.6% 6.3% 6.9%
Total 710 4,581 5,483 728 1,007 9,039 2,844 7,930 10,774
688 4,185 5,273 674 955 8,517 2,629 7,517 10,146
3.1% 9.5% 4.0% 8.0% 5.5% 6.1% 8.2% 5.5% 6.2%
1
Excludes nursery sta.
Table 14. Changes to pupil-teacher ratios
This table shows the pupil and teacher gender ratios along with pupil-teacher ratio in ISC schools that participated in the Census in 2022 and 2023.
Full-time Senior Mixed-age Junior
Single-sex:
boys'
Single-sex:
girls' Co-ed
Schools with
boarders
Day
schools Total
Boys 66,213 128,530 82,858 46,702 210 230,689 114,594 163,007 277,601
65,382 126,357 82,475 46,560 195 227,459 112,764 161,450 274,214
1.3% 1.7% 0.5% 0.3% 7.7% 1.4% 1.6% 1.0% 1.2%
Girls 58,487 145,756 65,692 181 76,720 193,034 99,500 170,435 269,935
57,193 143,019 64,734 127 76,031 188,788 97,031 167,915 264,946
2.3% 1.9% 1.5% 42.5% 0.9% 2.2% 2.5% 1.5% 1.9%
Total 124,700 274,286 148,550 46,883 76,930 423,723 214,094 333,442 547,536
122,575 269,376 147,209 46,687 76,226 416,247 209,795 329,365 539,160
1.7% 1.8% 0.9% 0.4% 0.9% 1.8% 2.0% 1.2% 1.6%
Ratios
Pupil-teacher
1
7.9:1 9.2:1 9.3:1 9.1:1 8.8:1 8.9:1 8.0:1 9.6:1 8.9:1
7.9:1 9.3:1 9.3:1 9.1:1 8.9:1 8.9:1 8.0:1 9.6:1 8.9:1
0.1% -0.6% -0.1% -0.7% -1.0% -0.1% 0.2% -0.6% -0.3%
Boys:girls (pupils) 1.1:1 0.9:1 1.3:1 258.0:1 0.0:1 1.2:1 1.2:1 1.0:1 1.0:1
1.1:1 0.9:1 1.3:1 366.6:1 0.0:1 1.2:1 1.2:1 1.0:1 1.0:1
-1.0% -0.2% -1.0% -29.6% 6.7% -0.8% -0.9% -0.5% -0.6%
Men:women (teachers)
2
0.9:1 0.6:1 0.4:1 1.3:1 0.3:1 0.6:1 0.8:1 0.5:1 0.6:1
0.9:1 0.6:1 0.4:1 1.3:1 0.3:1 0.6:1 0.8:1 0.5:1 0.6:1
-3.1% 0.8% -0.6% -2.7% 3.3% -0.8% -1.4% 0.2% -0.6%
Men:women (teaching assistants)
2
0.3:1 0.1:1 0.1:1 0.2:1 0.1:1 0.1:1 0.2:1 0.1:1 0.1:1
0.3:1 0.1:1 0.1:1 0.2:1 0.0:1 0.1:1 0.2:1 0.1:1 0.1:1
-16.3% 5.4% -13.2% -5.6% 24.8% -7.4% -2.7% -7.7% -5.9%
1
Pupil-teacher ratio excludes nursery teachers and nursery pupils.
2
Excludes nursery sta.

56
Table 15. Changes to
full-time teachers
This table shows the
number of full-time
teaching sta coming
into ISC schools (broken
down by previous
occupation) and leaving
schools (broken down by
destination). This table
comprises those schools
that participated in the
Census in both 2022
and 2023.
Arriving from Senior
Mixed-
age Junior
Single-sex:
boys'
Single-sex:
girls' Co-ed
Schools with
boarders
Day
schools Total
Independent schools 719 1,069 659 225 396 1,826 1,193 1,254 2,447
571 956 637 193 315 1,656 1,005 1,159 2,164
25.9% 11.8% 3.5% 16.6% 25.7% 10.3% 18.7% 8.2% 13.1%
State-funded schools 541 1,542 639 168 416 2,138 1,030 1,692 2,722
457 1,048 448 115 253 1,585 777 1,176 1,953
18.4% 47.1% 42.6% 46.1% 64.4% 34.9% 32.6% 43.9% 39.4%
ITT at university or 123 229 72 24 66 334 163 261 424
training college 135 222 63 38 73 309 176 244 420
-8.9% 3.2% 14.3% -36.8% -9.6% 8.1% -7.4% 7.0% 1.0%
New graduates 105 145 81 28 35 268 154 177 331
136 188 74 33 58 307 204 194 398
-22.8% -22.9% 9.5% -15.2% -39.7% -12.7% -24.5% -8.8% -16.8%
Industry 47 122 33 18 22 162 103 99 202
74 93 37 16 17 171 105 99 204
-36.5% 31.2% -10.8% 12.5% 29.4% -5.3% -1.9% 0.0% -1.0%
Outside the UK 163 299 154 53 71 492 312 304 616
140 221 112 50 53 370 234 239 473
16.4% 35.3% 37.5% 6.0% 34.0% 33.0% 33.3% 27.2% 30.2%
Other 503 983 462 105 378 1,465 806 1,142 1,948
483 1,040 490 118 387 1,508 795 1,218 2,013
4.1% -5.5% -5.7% -11.0% -2.3% -2.9% 1.4% -6.2% -3.2%
Total 2,201 4,389 2,100 621 1,384 6,685 3,761 4,929 8,690
1,996 3,768 1,861 563 1,156 5,906 3,296 4,329 7,625
10.3% 16.5% 12.8% 10.3% 19.7% 13.2% 14.1% 13.9% 14.0%
Going to
Independent schools 521 726 536 215 254 1,314 794 989 1,783
450 616 405 147 267 1,057 668 803 1,471
15.8% 17.9% 32.3% 46.3% -4.9% 24.3% 18.9% 23.2% 21.2%
State-funded schools 196 498 225 50 117 752 391 528 919
161 366 157 32 98 554 288 396 684
21.7% 36.1% 43.3% 56.3% 19.4% 35.7% 35.8% 33.3% 34.4%
Industry 121 205 78 27 57 320 200 204 404
68 113 54 12 30 193 107 128 235
77.9% 81.4% 44.4% 125.0% 90.0% 65.8% 86.9% 59.4% 71.9%
Outside the UK 101 204 100 30 52 323 167 238 405
105 152 104 30 44 287 160 201 361
-3.8% 34.2% -3.8% 0.0% 18.2% 12.5% 4.4% 18.4% 12.2%
Other (incl. retirement) 1,017 2,233 1,112 269 777 3,316 1,764 2,598 4,362
1,072 2,140 1,025 324 743 3,170 1,808 2,429 4,237
-5.1% 4.3% 8.5% -17.0% 4.6% 4.6% -2.4% 7.0% 3.0%
Total 1,956 3,866 2,051 591 1,257 6,025 3,316 4,557 7,873
1,856 3,387 1,745 545 1,182 5,261 3,031 3,957 6,988
5.4% 14.1% 17.5% 8.4% 6.3% 14.5% 9.4% 15.2% 12.7%
Net gain
Independent schools 198 343 123 10 142 512 399 265 664
121 340 232 46 48 599 337 356 693
63.6% 0.9% -47.0% -78.3% 195.8% -14.5% 18.4% -25.6% -4.2%
State-funded schools 345 1,044 414 118 299 1,386 639 1,164 1,803
296 682 291 83 155 1,031 489 780 1,269
16.6% 53.1% 42.3% 42.2% 92.9% 34.4% 30.7% 49.2% 42.1%
Industry -74 -83 -45 -9 -35 -158 -97 -105 -202
6 -20 -17 4 -13 -22 -2 -29 -31
-1333.3% -315.0% -164.7% -325.0% -169.2% -618.2% -4750.0% -262.1% -551.6%
Outside the UK 62 95 54 23 19 169 145 66 211
35 69 8 20 9 83 74 38 112
77.1% 37.7% 575.0% 15.0% 111.1% 103.6% 95.9% 73.7% 88.4%
Other -514 -1,250 -650 -164 -399 -1,851 -958 -1,456 -2,414
-589 -1,100 -535 -206 -356 -1,662 -1,013 -1,211 -2,224
12.7% -13.6% -21.5% 20.4% -12.1% -11.4% 5.4% -20.2% -8.5%
Total 245 523 49 30 127 660 445 372 817
140 381 116 18 -26 645 265 372 637
75.0% 37.3% -57.8% 66.7% 588.5% 2.3% 67.9% 0.0% 28.3%
Full-time teachers
Turnover as % of full- 14.8 16.6 17.9 13.2 19.4 16.3 15.2 17.4 16.4
time teachers 14.2 14.8 15.2 12.4 18.5 14.4 14.1 15.3 14.8
3.8% 11.9% 17.6% 7.0% 4.6% 13.0% 7.7% 13.8% 11.1%
Gain as % of full-time 1.9 2.2 0.4 0.7 2.0 1.8 2.0 1.4 1.7
teachers 1.1 1.7 1.0 0.4 -0.4 1.8 1.2 1.4 1.3
72.4% 34.6% -57.7% 64.4% 580.6% 1.0% 65.3% -1.2% 26.5%

Fig 1. ISC English Regions
Appendix Three
ISC Regions

2
t 020 7766 7070
First Floor
27 Queen Anne’s Gate
London
SW1H 9BU
www.isc.co.uk
A Company Limited by Guarantee.
Registered in England and Wales
No. 1103760
Constituent Associations:
Association of Governing Bodies of
Independent Schools
Girls’ Schools Association
HMC (The Heads’ Conference)
Independent Association of Prep Schools
Independent Schools Association
The Independent Schools’ Bursars Association
The Society of Heads
