
1
Basic lavaan Syntax Guide
1
James B. Grace
Last modified: August 1, 2013
Contents: (Basic Topics Only)
1. Getting Started
2. Types of lavaan Commands
a. Specification of a Model
b. Estimation/Fitting
c. Extracting Results
3. More Specification Options
a. Correlating Errors
c. Naming Parameters
d. Fixing Parameter Values to Specific Quantities
4. More Estimation Options
a. Estimating Intercepts
b. Obtaining Estimates of Correlations/Covariances Between Exogenous Variables
5. More Options for Extracting Results
a. Extracting the Parameter Estimates
b. Standardized Estimates
c. Model Fit Statistics
d. Modification Indices
e. Residual Covariances
1
Adapted from Rosseel, Y. June 14, 2011. “Lavaan Introduction.pdf”

2
---------------------------------------------
1. Getting Started
A few basic points:
Lavaan is an R package for classical structural equation modeling (SEM).
An elementary introduction to SEM designed for those in the natural sciences can be found in
Grace (2006). Another treatment for biologists with slightly different emphases has been written
by Shipley (2000). For first time users in the social sciences, Kline’s (2010) book provides an
good entry-level treatment. Technical fundamentals for classic SEM are presented in Bollen
(1989). A new handbook is Hoyle (2012).
Links to documentation on lavaan can be found at the lavaan site: http://lavaan.ugent.be/.
Included at that site is a more extensive introduction “lavaanIntroduction.pdf” and a technical
manual “lavaanIntroduction.pdf”.
Lavaan is generally updated fairly frequently, so it is good to keep your version of R up to date.
You can download the latest version of R from: http://cran.r-project.org/.
The lavaan package is currently still a beta-version package and not considered complete. That
said, it is approaching the functionality of some commercial packages.
One feature of lavaan is that it does not require you to be an expert in R. You do need to know
how to import datasets into R and how to execute commands. You also need to know how to
install and load packages. The lavaan syntax is simple and requires only general background
knowledge, not a deep familiarity with the R language.
The numerical results of the lavaan package are typically very close, if not identical, to the
results of the commercial package Mplus. If you wish to compare the results with those obtained
by other SEM packages, there are options available for doing so.
In this presentation, as is common in the biometric tradition of structural equations, the inclusion
of latent variables in models is considered an advanced topic and covered later.
This presentation focuses on the lavaan command language and does not attempt to provide
theoretical background or interpretational information about SEM.

3
2. Types of lavaan Commands
There are three types of command statements to use when working with lavaan, (a) specification
statements, (b) estimation statements, and (c) statements for extracting results. The reader should
be aware that there are additional steps in the SEM process, particularly leading from theory to
model specification and also following the extraction of results (Grace et al. 2010, Grace et al.
2012). Here is a preview of the three main lavaan commands, which will be explained
subsequently.
### Preview of three types of lavaan commands
### Command type 1: specify model by declaring an object
model <- 'y1 ~ x1 + x2 # model defined in quotes
y2 ~ y1 + x2'
### Command type 2: estimate parameters for the model
model.est <- sem(model, data=data.mod1) # sem command is used
### Command type 3: extract results from estimated model object
summary(model.lav2.est, rsq=T) # summary of results
a. Specification of a Model
At the heart of the lavaan package is the model ‘syntax'. The model syntax is a description of the
model to be estimated. In this section, I briefly present the lavaan model syntax for modeling
with observed variables. More syntax will be introduced in later sections.
In the R environment, a regression formula has the following form:
y ~ x1 + x2
In lavaan, a typical model is simply a set (or system) of equations contained within quotation
marks. Here is a model (model.1) and its syntax:
model.1 <- ‘y1 ~ x1 + x2
y2 ~ y1 + x2’

4
Note that the equations (there are two in this example) are “string literals”, i.e., by placing them
in quotes we make them essentially character statements. Lavaan interprets the statements in
their parts, recognizing that there are three variables (y1, x1, and x2) and two operators (~, +) in
the first literal and three variables (y2, y1, and x2) and two operators (~, +) in the second as
well. Also note exogenous variables are allowed to correlate by default in lavaan.
The four basic types of specification operators in lavaan are:
formula type operator operator stands for
regression ~ “regressed on”
correlation ~~ “correlated with”
intercept ~ 1 “estimates intercept”
latent variable definition =~ “is measured by”
create a composite <~ “is caused by”
b. Estimation/Fitting
Lavaan has command statements for estimating different types of models. The most basic
command is “sem”. Here I show how we can estimate the parameters in the above model.
model.1.ests <- sem(model.1, data = data.mod1)
Here, “model.1” refers to the model specification assigned to the object and “data.mod1” is the
name for the data object in R.
c. Extracting Results
There are a variety of ways of extracting results from the estimated object. Here is the most basic
extraction statement.
summary(model.1.ests)
Asking for a summary of the results gives the text below. Here we can see that lavaan converged
to a stable solution. Other basic information is given.
5
> summary(model.1.ests)
lavaan (0.4-12) converged normally after 40 iterations
Number of observations 90
Estimator ML
Minimum Function Chi-square 23.222
Degrees of freedom 1
P-value 0.000
Parameter estimates:
Information Expected
Standard Errors Standard
Estimate Std.err Z-value P(>|z|)
Regressions:
y1 ~
x1 0.001 0.004 0.327 0.744
x2 -0.083 0.019 -4.440 0.000
y2 ~
y1 9.910 5.083 1.950 0.051
x2 -2.531 0.976 -2.593 0.010
Variances:
y1 0.080 0.012
y2 187.212 27.908
3. More Specification Options
There are a number of additional options available that permit further specifications. Here I
present several of the basic ones. More advanced commands are presented in a later section.
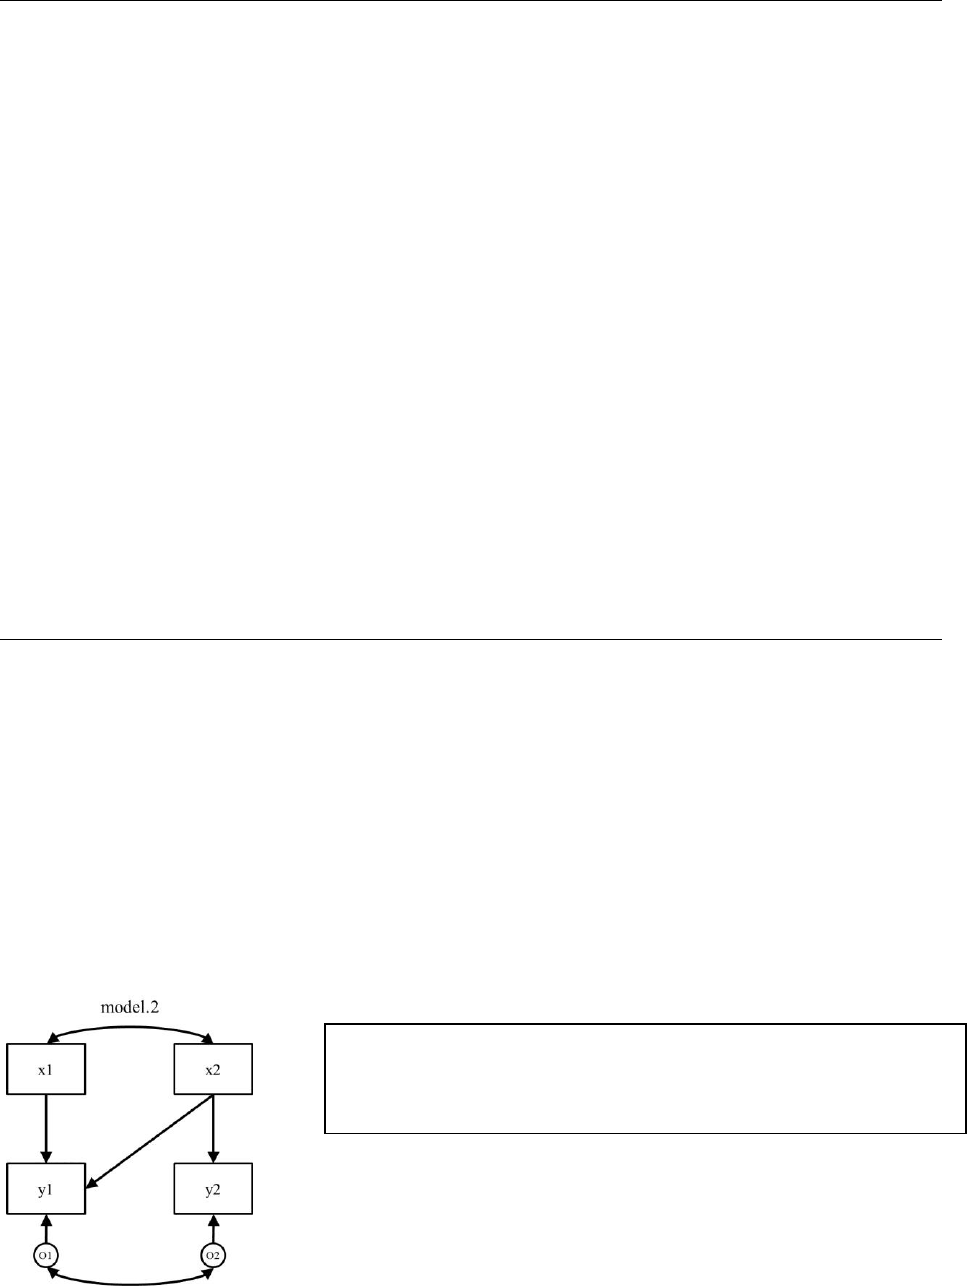
a. Correlating Errors
Let’s imagine a case where we have two endogenous responses that have a residual
correlation/covariance. In the case where there is residual covariation (literally, a
correlation/covariance between the prediction residuals caused by some other unspecified factor
influencing both variables), we represent it as an error correlation/covariance.
model.2 <- ‘y1 ~ x1 + x2
y2 ~ x2
y1 ~~ y2’ #error covariance

6
It is important to note here the common convention that when a correlation is specified between
two endogenous variables, it is understood that the correlation is a residual correlation and
therefore, a correlation between their prediction errors (strictly speaking in causal modeling,
what statisticians would call prediction errors represent other factors affecting a variable).
Results presented below include a covariance between y1 and y2, which has now been requested.
> summary(model.2.ests)
lavaan (0.4-12) converged normally after 35 iterations
Number of observations 90
Estimator ML
Minimum Function Chi-square 22.879
Degrees of freedom 1
P-value 0.000
Parameter estimates:
Information Expected
Standard Errors Standard
Estimate Std.err Z-value P(>|z|)
Regressions:
y1 ~
x1 -0.003 0.004 -0.763 0.446
x2 -0.087 0.019 -4.643 0.000
y2 ~
x2 -3.363 0.896 -3.752 0.000
Covariances:
y1 ~~
y2 0.945 0.432 2.189 0.029
Variances:
y1 0.081 0.012
y2 195.119 29.087
b. Naming Parameters
There are a number of operations that require us to name parameters. By naming parameters, we
can then specify their values or constrain their values using constraint equations.
Actually, lavaan names parameters automatically using the convention shown in output above.
For example, the parameter for the effect of x1 on y1 is named “y1 ~ x1”.
It can be useful to name parameters in the more conventional way. Since we are used to
expressing equations like this,
y1 = b1*x1,

7
we might prefer “b1” over “y1 ~ x1” as a parameter name. The simplest way to do this is to
premultiply a predictor with the name being assigned to the parameter. Here we give the
parameters in model.2 the names b1-b5. Note, parameter labels must start with a letter!
Now, we get the following output, which shows both labels, original and new.
> summary(model.2a.ests)
lavaan (0.4-12) converged normally after 35 iterations
Number of observations 90
Estimator ML
Minimum Function Chi-square 22.879
Degrees of freedom 1
P-value 0.000
Parameter estimates:
Information Expected
Standard Errors Standard
Estimate Std.err Z-value P(>|z|)
Regressions:
y1 ~
x1 (b1) -0.003 0.004 -0.763 0.446
x2 (b2) -0.087 0.019 -4.643 0.000
y2 ~
x2 (b3) -3.363 0.896 -3.752 0.000
Covariances:
y1 ~~
y2 (b4) 0.945 0.432 2.189 0.029
Variances:
y1 0.081 0.012
y2 195.119 29.087
model.2a <- ‘y1 ~ b1*x1 + b2*x2
y2 ~ b3*x2
y1 ~~ b4*y2’

8
c. Fixing Parameter Values to Specific Quantities
There are times when we want to be able to specify that particular parameters have fixed
quantitative values. Lavaan allows us to do this using various options. Here is one approach:
In this model statement, x1 is pre-multiplied by zero to set its value to zero. We can also
accomplish this using a more elaborate and more flexible approach:
Now we have labeled the parameter “b1” and then assigned it a value of 0 in a separate
statement. This second specification will actually result in an explicit test of the constraint.
> summary(model.2c.ests)
lavaan (0.4-12) converged normally after 158 iterations
Estimator ML
Minimum Function Chi-square 23.329
Degrees of freedom 2
P-value 0.000
Parameter estimates:
Information Expected
Standard Errors Standard
Estimate Std.err Z-value P(>|z|)
Regressions:
y1 ~
x1 (b1) 0.000 0.000 169.705 0.000
x2 (b2) -0.084 0.018 -4.611 0.000
y2 ~
x2 (b3) -3.362 0.896 -3.752 0.000
Covariances:
y1 ~~
y2 (b4) 0.798 0.426 1.872 0.061
Variances:
y1 0.081 0.012
y2 195.119 29.087
Constraints: Slack (>=0)
b1 - 0 0.000
model.2b <- ‘y1 ~ 0*x1 + x2
y2 ~ x2
y1 ~~ y2’
model.2c <- ‘y1 ~ b1*x1 + x2
y2 ~ x2
y1 ~~ y2
b1 == 0’

9
4. More Estimation Options
a. Estimating Intercepts
By default, lavaan sets the scales for the variables to zero, placing the emphasis on the other
parameters (e.g., path coefficients). One advantage for this default (along with the default of not
estimating exogenous covariances) is that we don’t estimate as many parameters, which is
helpful when sample sizes are limited. However, there certainly are times when we want the
estimates for intercepts (e.g., for generating prediction equations). Obtaining these additional
parameters is easy, as it only requires overriding a default in the estimation statement. Here we
revisit model.1 and ask for intercepts (for endogenous variables) using the “meanstructure”
statement.
model.1.ests <- sem(model.1, data = data.frame,
+ meanstructure = TRUE)
Actually, we could accomplish the same thing by adding command statements of the form
“x1 ~ 1” to specify means and intercepts as parameters.
Both approaches produce the following results:
Estimate Std.err Z-value P(>|z|)
Regressions:
y1 ~
x1 0.001 0.004 0.327 0.744
x2 -0.083 0.019 -4.440 0.000
y2 ~
y1 9.910 5.083 1.950 0.051
x2 -2.531 0.976 -2.593 0.010
Intercepts:
y1 1.004 0.233 4.318 0.000
y2 53.936 6.925 7.788 0.000
Variances:
y1 0.080 0.012
y2 187.212 27.908
model.1a <- ‘y1 ~ x1 + x2
y2 ~ y1 + x2
y1 ~ 1
y2 ~ 2’

10
b. Obtaining Estimates of Correlations/Covariances Between
Exogenous Variables
Lavaan follows the convention that the exogenous correlations/covariances are not estimated, but
instead are taken as pre-estimated in the covariance matrix. This means, if we want to know what
the covariances or correlations are between exogenous variables (and we will), we need to obtain
them from the data or ask that they be estimated (override the default specification). All we need
to do is include an additional statement, “fixed.x=FALSE”. Here we return to model.2 and
simply ask for the x (exogenous) variables to be freely estimated instead of being fixed at the
values found in the covariance matrix (e.g., “fixed.x=FALSE”).
Now we obtain an estimate of the covariance in our lavaan output, as shown in bold below.
Estimate Std.err Z-value P(>|z|)
Regressions:
y1 ~
x1 -0.003 0.004 -0.763 0.446
x2 -0.087 0.019 -4.643 0.000
y2 ~
x2 -3.363 0.896 -3.752 0.000
Covariances:
y1 ~~
y2 0.945 0.432 2.189 0.029
x1 ~~
x2 -2.651 1.352 -1.961 0.050
Variances:
y1 0.081 0.012
y2 195.119 29.087
x1 58.313 8.693
x2 2.700 0.402
We could have obtained our estimate of the exogenous covariance between x1 and x2 in R
simply by using the command “cov()”
#estimating covariance between x1 and x2 directly
print(cov(x1,x2))
#estimating the model
model.2d.ests <- sem(model.2, data = data.mod1, fixed.x=FALSE)

11
Of course, we can also ask for the full covariance matrix using the following statement.
### Ask for the full covariance matrix
print(cov(data.mod1))
5. More Options for Extracting Results
Lavaan has numerous options for obtaining additional output from the model object. Here I focus
on 5 key types of information that are commonly required for reporting results and evaluating
models.
a. Extracting the Parameter Estimates
Lavaan has several extraction functions for pulling specific information from the estimated
model object. Here I demonstrate one of the most basic, the “parameterEstimates” function.
Below I will demonstrate other functions at appropriate places. For model.1, we can extract just
the parameter estimates using the following syntax:
model.1.ests <- sem(model.1, data = data.mod1)
parameterEstimates(model.1.ests)
> parameterEstimates(model.1.ests)
lhs op rhs est se z pvalue ci.lower ci.upper
1 y1 ~ x1 0.001 0.004 0.327 0.744 -0.007 0.009
2 y1 ~ x2 -0.083 0.019 -4.440 0.000 -0.119 -0.046
3 y2 ~ y1 9.910 5.083 1.950 0.051 -0.052 19.873
4 y2 ~ x2 -2.531 0.976 -2.593 0.010 -4.444 -0.618
5 y1 ~~ y1 0.080 0.012 6.708 0.000 0.057 0.104
6 y2 ~~ y2 187.212 27.908 6.708 0.000 132.513 241.911
7 x1 ~~ x1 58.314 0.000 NA NA 58.314 58.314
8 x1 ~~ x2 -2.652 0.000 NA NA -2.652 -2.652
9 x2 ~~ x2 2.700 0.000 NA NA 2.700 2.700
Note we get some additional information, the confidence intervals.
b. Standardized Estimates
We can request standardized coefficients very easily by adding a statement to the summary
command. Here we return to model.1 and request standardized parameter estimates and r-
squares.
summary(model.1.ests, standardized=TRUE, rsq=TRUE)

12
which produces the following (only partial output shown).
Estimate Std.err Z-value P(>|z|) Std.lv Std.all
Regressions:
y1 ~
x1 0.001 0.004 0.327 0.744 0.001 0.032
x2 -0.083 0.019 -4.440 0.000 -0.083 -0.430
y2 ~
y1 9.910 5.083 1.950 0.051 9.910 0.208
x2 -2.531 0.976 -2.593 0.010 -2.531 -0.277
Variances:
y1 0.080 0.012 0.080 0.808
y2 187.212 27.908 187.212 0.830
R-Square:
y1 0.192
y2 0.170
Note that the column “Std.lv” only standardizes any latent variables in the model (none in
model.1, so that column is same as “Estimate” column). “Std.all” results are what we want in
most cases.
Lavann has alternative methods for extracting standardize results and as stated before, these
alternative methods can be very helpful when working in R because they yield objects containing
key information. Here is a function “standardizedSolution” to extract standardized results.
> standardizedSolution(model.1.ests)
lhs op rhs est.std se z pvalue
1 y1 ~ x1 0.032 NA NA NA
2 y1 ~ x2 -0.430 NA NA NA
3 y2 ~ y1 0.208 NA NA NA
4 y2 ~ x2 -0.277 NA NA NA
5 y1 ~~ y1 0.808 NA NA NA
6 y2 ~~ y2 0.830 NA NA NA
7 x1 ~~ x1 1.000 NA NA NA
8 x1 ~~ x2 -0.211 NA NA NA
9 x2 ~~ x2 1.000 NA NA NA
Here, “lhs”=left-hand-side, “op”=operator, “rhs”=right-hand-side, and “est.std”=standardized
estimates. Note that only the raw (unstandardized) estimates have standard errors and related
properties reported.

13
c. Model Fit Statistics
Also of critical importance is the ability to obtain a more complete reporting of model fit
statistics. Again, we have two options, one within the “summary” command and another separate
function. Again for model.1,
summary(model.1.ests, fit.measures=TRUE)
yields the following:
lavaan (0.4-12) converged normally after 40 iterations
Number of observations 90
Estimator ML
Minimum Function Chi-square 23.222
Degrees of freedom 1
P-value 0.000
Chi-square test baseline model:
Minimum Function Chi-square 59.220
Degrees of freedom 5
P-value 0.000
Full model versus baseline model:
Comparative Fit Index (CFI) 0.590
Tucker-Lewis Index (TLI) -1.049
Loglikelihood and Information Criteria:
Loglikelihood user model (H0) -858.441
Loglikelihood unrestricted model (H1) -846.830
Number of free parameters 6
Akaike (AIC) 1728.882
Bayesian (BIC) 1743.881
Sample-size adjusted Bayesian (BIC) 1724.945
Root Mean Square Error of Approximation:
RMSEA 0.497
90 Percent Confidence Interval 0.335 0.681
P-value RMSEA <= 0.05 0.000
Standardized Root Mean Square Residual:
SRMR 0.134

14
We can also use the extractor function “fitMeasures”.
fitMeasures(model.1.ests)
which produces
> fitMeasures(model.1.ests)
chisq df pvalue baseline.chisq
23.222 1.000 0.000 59.220
baseline.df baseline.pvalue cfi tli
5.000 0.000 0.590 -1.049
logl unrestricted.logl npar aic
-858.441 -846.830 6.000 1728.882
bic ntotal bic2 rmsea
1743.881 90.000 1724.945 0.497
rmsea.ci.lower rmsea.ci.upper rmsea.pvalue srmr
0.335 0.681 0.000 0.134
We can be more surgical with our function and ask for specific measures:
fitMeasures(model.1.ests, “bic”)
which yields
> fitMeasures(model.1.ests, "bic")
bic
1743.881
There are also “BIC” and “AIC” functions.
> AIC(model.1.ests)
[1] 1728.882
> BIC(model.1.ests)
[1] 1743.881
>
Not all fit measures can be accessed in this way.

15
d. Modification Indices
Diagnosing lack of fit in models is of critical importance. In classical SEM, model fit is
evaluated via discrepancies beween observed and model-implied covariances, which are
summarized using the above fit measures. Specific discrepancies are also of vital importance.
Again, there are two approaches.
summary(model.1.ests, modindices=TRUE)
which yields:
lhs op rhs mi epc sepc.lv sepc.all sepc.nox
1 y1 ~~ y1 0.000 0.000 0.000 0.000 0.000
2 y1 ~~ y2 20.468 -53.694 -53.694 -11.331 -11.331
3 y1 ~~ x1 NA NA NA NA NA
4 y1 ~~ x2 0.009 851.155 851.155 1642.024 851.155
5 y2 ~~ y2 0.000 0.000 0.000 0.000 0.000
6 y2 ~~ x1 20.419 48.615 48.615 0.424 48.615
7 y2 ~~ x2 20.468 49.621 49.621 2.010 49.621
8 x1 ~~ x1 0.000 0.000 0.000 0.000 0.000
9 x1 ~~ x2 0.000 0.000 0.000 0.000 0.000
10 x2 ~~ x2 0.000 0.000 0.000 0.000 0.000
11 y1 ~ y2 20.468 -0.287 -0.287 -13.657 -13.657
12 y1 ~ x1 0.000 0.000 0.000 0.000 0.000
13 y1 ~ x2 0.000 0.000 0.000 0.000 0.000
14 y2 ~ y1 0.000 0.000 0.000 0.000 0.000
15 y2 ~ x1 20.468 0.875 0.875 0.445 0.058
16 y2 ~ x2 0.000 0.000 0.000 0.000 0.000
17 x1 ~ y1 0.000 0.000 0.000 0.000 0.000
18 x1 ~ y2 17.594 0.224 0.224 0.440 0.440
19 x1 ~ x2 0.000 0.000 0.000 0.000 0.000
20 x2 ~ y1 0.000 0.000 0.000 0.000 0.000
21 x2 ~ y2 2.520 0.033 0.033 0.298 0.298
22 x2 ~ x1 0.000 0.000 0.000 0.000 0.000
Or we can get the same information using,
modindices(model.1.ests)
This second approach gives us some additional flexibility, for example we can extract only those
indices that suggest directed arrows be added (i.e., operator is ~).
mi <- modindices(model.1.ests)
print(mi[mi$op == "~",])
Now we only get the following:

16
lhs op rhs mi epc sepc.lv sepc.all sepc.nox
1 y1 ~ y2 20.468 -0.287 -0.287 -13.657 -13.657
2 y1 ~ x1 0.000 0.000 0.000 0.000 0.000
3 y1 ~ x2 0.000 0.000 0.000 0.000 0.000
4 y2 ~ y1 0.000 0.000 0.000 0.000 0.000
5 y2 ~ x1 20.468 0.875 0.875 0.445 0.058
6 y2 ~ x2 0.000 0.000 0.000 0.000 0.000
7 x1 ~ y1 0.000 0.000 0.000 0.000 0.000
8 x1 ~ y2 17.594 0.224 0.224 0.440 0.440
9 x1 ~ x2 0.000 0.000 0.000 0.000 0.000
10 x2 ~ y1 0.000 0.000 0.000 0.000 0.000
11 x2 ~ y2 2.520 0.033 0.033 0.298 0.298
12 x2 ~ x1 0.000 0.000 0.000 0.000 0.000
e. Residual Covariances
In addition to looking at modification indices, it can be useful sometimes to look at residuals.
Here we are talking about residuals in the covariance matrix, not in the data values themselves (a
topic I deal with elsewhere). We can use the “resid” function for this purpose, which includes the
option of looking at the standardized residuals.
#getting residuals
resid(model.1.ests, type="standardized")
which yields,
> resid(model.1.ests, type="standardized")
$cov
y1 y2 x1 x2
y1 0.000
y2 0.000 0.004
x1 0.000 3.942 0.000
x2 0.000 0.000 0.000 0.000

17
References:
Bollen, K. A. 1989. Structural equations with latent variables. John Wiley & Sons, New York,
New York, USA.
Grace, J. B. 2006. Structural equation modeling and natural systems. Cambridge University
Press, Cambridge. UK.
Grace, J.B., Anderson, T.M., Olff, H., and Scheiner, S.M. 2010. On the specification of
structural equation models for ecological systems. Ecological Monographs 80:67-87.
(http://www.esajournals.org/doi/abs/10.1890/09-0464.1)
Grace, J.B., Schoolmaster, D.R. Jr., Guntenspergen, G.R., Little, A.M., Mitchell, B.R., Miller,
K.M., and Schweiger, E.W. 2012. Guidelines for a graph-theoretic implementation of
structural equation modeling. Ecosphere 3(8): article 73 (44 pages).
(http://www.esajournals.org/doi/abs/10.1890/ES12-00048.1)
Hoyle, R.H. (ed.) 2012. Handbook of Structural Equation Modeling. The Guilford Press, NY.
Kline, R.B. 2010. Principles and Practice of Structural Equation Modeling. Guilford Press, New
York, New York, USA.
Shipley, B. 2000. Cause and correlation in biology. Cambridge University Press, Cambridge,
UK.
