
Local development
tax incentives in
northeastern Illinois
Contents
Introduction ............................................................................................................................ 5
Fiscal principles of development incentives ............................................................................. 8
Overall incentive use in northeastern Illinois ......................................................................... 12
How much are incentives used in northeastern Illinois? ............................................................... 12
Which communities are most likely to use incentives? ............................................................... 14
What types of properties are incentivized? ................................................................................. 16
Use of specific incentives ....................................................................................................... 22
Sales tax rebates ........................................................................................................................... 22
Property tax abatements .............................................................................................................. 29
Cook County incentive classification ............................................................................................ 31
Tax increment financing ................................................................................................................ 38
Implementing ON TO 2050 .................................................................................................... 44
Moving forward ..................................................................................................................... 48

Local development
Page 4 of 48 tax incentives

Local development
Page 5 of 48 tax incentives
Introduction
ON TO 2050 — northeastern Illinois’ long-range, comprehensive plan — calls for economic
development that enables more communities to thrive. Greater collaboration to reduce
inequity, leverage our existing assets, and develop talent-driven, export-oriented businesses
can sustain and broaden the region’s prosperity. But current policies often fail to provide
communities with adequate supports to address local needs and align local development with
regional goals. Many local governments are left with few options but to compete for limited
growth through the use of local development tax incentives — offered in pursuit of private
investment, a larger tax base, and jobs.
Incentives are in active use in more than three-quarters of northeastern Illinois’ municipalities
(218 out of 284). Elected officials and economic developers representing several types of taxing
districts turn to these tools in response to competition with other communities, proximity to
lower-tax areas, and substantial variation in development demand across the region. In the face
of revenue and staff constraints, local governments often find that tax incentives are one of the
few accessible, functional tools available to achieve their development goals. They can be
especially useful for promoting aims like infill development or remediating brownfields, where
desired locations have extraordinary costs.
Reflecting national trends, incentive use in the region is expanding.
1
The number of
municipalities in the region with active local incentives has increased by 5 percent since 2013.
Today, local tax incentives impact the revenue-generating capacity of 26 percent of the region’s
commercial and industrial development.
With limited resources, local governments are looking for strategies to effectively meet local
needs. This is particularly true in places that have experienced a marked decline of public and
private investment over decades. Disinvested communities can fall into cycles of slow growth if
a weakening tax base leads to gaps in local tax burdens and the funding available to provide
public services. But incentives often provide more transactional than transformational results,
closing the financial gap for certain developments rather than addressing underlying issues.
Inclusive economic growth depends on the drivers that create real value in our economy, like a
skilled workforce, racial integration and equity, a robust industry mix, the ecosystem to support
new ideas, and the infrastructure to effectively deliver goods and services. The practice of
incentivizing local growth does little to improve these fundamental assets while leaving less
room for collaborative, regional approaches to economic development.
1
Terry F. Buss, “The Effect of State Tax Incentives on Economic Growth and Firm Location Decisions: An Overview of the
Literature,” Economic Development Quarterly 15, no. 1 (February 2001): 92, https://doi.org/10.1177/089124240101500108;
Timothy J. Bartik, “A New Panel Database on Business Incentives for Economic Development Offered by State and Local
Governments in the United States” (Prepared for the Pew Charitable Trusts, 2017), https://research.upjohn.org/reports/225;
Mary Donegan, T. William Lester, and Nichola Lowe, “Striking a Balance: A National Assessment of Economic Development
Incentives,” Working Paper (Kalamazoo, MI: W.E. Upjohn Institute, 2018), 3, https://doi.org/10.17848/wp18-291.

Local development
Page 6 of 48 tax incentives
Local incentives also present risks. Poorly targeted incentives can lead to high costs, diminishing
returns, and intraregional competition. Despite their widespread use, nearly all academic
evidence shows that incentives produce no significant benefits for long-term regional growth.
While tax incentives can fill certain financial gaps for businesses, recent research estimates that
many agreements make no impact on business location decisions.
2
State and local taxes
represent on average less than 2 percent of total business costs in the U.S., and major expenses
like employee compensation or freight transportation tend to factor more into overall
production costs.
3
Many incentivized developments also fail to generate net fiscal gains or improve the quality of
life for existing local residents.
4
And indirect and longer-term effects of incentive use — like
increased burdens on public infrastructure and intraregional competition on tax rates — can
diminish the benefits of incentivized development, often most of all in communities with the
greatest need for new growth.
Public dataset available
This report is based on a dataset of public records compiled by the Chicago Metropolitan
Agency for Planning (CMAP) from many sources. Alongside this report, CMAP has published
much of the related data for further analysis. Learn more and access the data online on the
CMAP Data Hub at https://datahub.cmap.illinois.gov/dataset/local-tax-incentives-
prevalence-by-municipality.
Decisionmakers should pursue programs, policies, and reforms that equitably support all
communities, improve regional cooperation, and enhance northeastern Illinois’ overall
economic position. CMAP is providing new analysis on the prevalence and distribution of local
development tax incentives to support such structural solutions. Regional and state actions,
including modernizing tax policies and reinvesting in disinvested areas, are needed to enable
more communities to work together and improve local outcomes. This report details four
recommendations defined in ON TO 2050 and connects them to incentive use in the region:
2
Timothy J. Bartik, “‘But For’ Percentages for Economic Development Incentives: What Percentage Estimates Are Plausible
Based on the Research Literature?” (W.E. Upjohn Institute, July 1, 2018), https://doi.org/10.17848/wp18-289; Stephan J Goetz
et al., “Sharing the Gains of Local Economic Growth: Race-to-the-Top versus Race-to-the-Bottom Economic Development,”
Environment and Planning C: Government and Policy 29, no. 3 (June 2011): 428–56, https://doi.org/10.1068/c1077r.
3
CMAP analysis of U.S. Internal Revenue Service and the Council on State Taxation data.
4
Cailin Slattery and Owen Zidar, “Evaluating State and Local Business Tax Incentives” (Cambridge, MA: National Bureau of
Economic Research, January 2020), https://doi.org/10.3386/w26603; Timothy J. Bartik, “Who Benefits From Economic
Development Incentives? How Incentive Effects on Local Incomes and the Income Distribution Vary with Different Assumptions
about Incentive Policy and the Local Economy,” Technical Report (Kalamazoo, MI: W.E. Upjohn Institute, March 1, 2018),
https://doi.org/10.17848/tr18-034; Mark D Partridge and Dan S Rickman, “Do We Know Economic Development When We See
It?,” Review of Regional Studies 33 (2003): 17–39.

Local development
Page 7 of 48 tax incentives
Modernize tax policies to sustain communities of all types, including expanding the
state sales tax base, reforming the state’s approach to disbursing state revenues to local
governments, and phasing out the Cook County property tax classification system.
Invest in disinvested areas, including developing creative approaches to supporting
fiscally constrained communities, supporting catalytic public investments, and
developing new programs to enable strategic investments in weak market areas.
Reform incentives for economic development, including encouraging state and local
governments to use incentive best practices like conducting fiscal impact analyses and
establishing terms and conditions that limit taxing districts’ financial liability.
Institute stronger standards for transparency and accountability of incentives,
including requiring consistent and comprehensive public reporting, regular program
audits, and sunset provisions that enable periodic program reevaluation.
Implementing these changes will help make northeastern Illinois a national leader in effective
incentive use while enhancing the region’s economic and fiscal positions. CMAP supports taking
steps that will improve the effectiveness and transparency of local development incentive
programs and encourage more inclusive economic growth. This will, in turn, reduce the need to
incentivize local development.
This report focuses on four types of incentives common in northeastern Illinois: sales tax
rebates, Cook County’s incentive classification system, property tax abatements, and tax
increment financing. These tools are all locally controlled, are enabled by county ordinances
and state law, and have potentially large impacts on community finances.
5
The report begins
with a review of key fiscal principles that underpin local incentive use. The following two
sections review new findings on incentive use in the region, first overall and then by incentive
type. The final section details recommendations and next steps for moving forward.
Guidance for local governments on effective incentive use
Local governments can improve the administration of incentives to enhance their impact.
CMAP’s best practices guide, Improving local development incentives, provides
recommendations and strategies tailored to the needs and experiences of local governments
in northeastern Illinois. Published in September 2020, it identifies principles, strategies, and
practices to better align incentives with local and regional goals, including how to approach
incentive policy design, negotiations with businesses, and program evaluation. Learn more at
https://www.cmap.illinois.gov/programs/innovation/local-incentives.
5
Governments use many tools to influence development outcomes. This report does not address state and federal programs —
such as River Edge Development Zones and federal Opportunity Zones — which are less likely to affect local government
finances and many of which are not administered locally. This report also does not address non-tax local incentives like
streamlined permitting processes, entrepreneurial supports, and job training. Although these are often best practices for
attracting growth, no reporting structures exist to track their use.

Local development
Page 8 of 48 tax incentives
Fiscal principles of development incentives
The actual fiscal impacts of development incentives are complex. Incentives benefit recipients
through lower tax bills, reimbursed tax payments, or publicly financed improvements on the
promise of bringing development and fiscal returns to the community. This trade-off — upfront
financial outlays for the chance at long-term gains — is core to incentives’ logic and structure.
But incentives do not necessarily reduce the revenue that local governments collect, nor are
they guaranteed to enhance local tax bases through greater development. Measuring the
actual impact of incentive use requires both an understanding of how they interact with tax
structures, as well as assumptions about what would have occurred in their absence.
Types of local development tax incentives
Local governments raise revenue from multiple sources, including taxes, user fees, and
intergovernmental transfers. The typical municipality in northeastern Illinois relies on property
taxes for 22.6 percent of their revenues and on state and local sales taxes for 17.5 percent.
6
The box on page 9 describes these two major revenue sources. Each of the four incentives
discussed in this report affects either the amount of revenue collected from the sales or
property tax, or the distribution of tax burden among taxpayers.
Sales tax rebates are revenue-sharing agreements that municipalities or counties form
with businesses and developers to refund a portion of the local share of the state sales
tax, any local option sales tax, or any business district sales tax.
Property tax abatements provide a discount on a property’s final tax bill. Any local
government that extends a property tax can abate its taxes in various contexts.
Incentive classification decreases a property’s assessed value for tax purposes by
lowering its assessment ratio. It is only available in Cook County, which assesses
commercial and industrial property at a higher rate than residential property.
Tax increment financing (TIF) freezes property values within a blighted area or area that
may become blighted, and taxes any new value in that area separately. Property tax
rates applied to increases in value (the increment) generate revenues that can be used
to fund eligible public and private redevelopment projects.
6
CMAP analysis of Illinois Office of the Comptroller data. Analysis includes only general, special revenue, capital project, and
debt service funds.

Local development
Page 9 of 48 tax incentives
Understanding municipal revenues
Sales tax
What is commonly known as the “sales tax” is
actually a complex combination of taxes.
7
In
general, the Illinois state sales tax rate is 6.25
percent for most merchandise and 1 percent
for sales of qualifying food, drugs, and
medical devices. Very few services are taxed
in Illinois. Municipalities receive 1 percentage
point of the 6.25 percent rate on general
merchandise sold within their borders, and
the full amount collected from qualifying
goods. Counties receive a quarter of a
percentage point of the state rate on general
merchandise, and the municipal portion of
either rate in unincorporated areas. Revenues
from remote sales are distributed based on
the point of delivery.
In addition to the state rate, municipalities
and counties can impose taxes on some
general merchandise sales. Excluded are
qualifying food, drugs, and medical devices, as
well as items titled or registered with the
state. For municipalities, these local option
sales taxes range between 0.25 to 2 percent.
Across the region, 67 percent of municipalities
impose this additional tax, most often using a
1 percent rate.
Municipalities can also establish business
development districts (BDDs) in blighted
commercial areas and impose an additional
sales tax to fund redevelopment within the
district. This sales tax can range from 0.25 to
1 percent, with most BDDs in the region
imposing the maximum 1 percent rate.
Property tax
The property tax is a local tax charged on
the estimated value of land and any
permanent improvements (e.g., buildings)
located on it. In Illinois, property tax rates
are recalculated every year to cover each
taxing district’s extension — that is, the
amount of revenue that the district needs
and is authorized to collect.
8
Approximately
1,200 taxing districts — including counties,
townships, municipalities, school districts,
and many others — impose a property tax in
the region, generating $22.8 billion in total
revenue in 2019.
To calculate property taxes in Illinois, county
assessors first estimate the fair market
value of all properties, then apply an
assessment ratio to that market value to
determine each property’s assessed value.
The Illinois Department of Revenue then
calculates an equalization factor for each
county to ensure a consistent ratio and
uniform assessments across the state.
Counties apply their equalization factor to
assessed values to produce an equalized
assessed value (EAV). The sum of EAV in
each taxing district, minus any exemptions,
is the district’s tax base. Tax rates are
calculated by dividing each district’s
extension by their tax base.
County clerks then multiply a property’s
taxable value by each district’s tax rate and
sum the resulting amounts due across taxing
districts, resulting in its final tax bill.
7
In Illinois, “sales tax” generally refers to the following taxes levied on certain goods and services: retailers’ occupation tax, use
tax, service occupation tax, service use tax, and hotel operators’ occupation tax.
8
In Illinois, most property tax extensions are limited by PTELL: the Property Tax Extension Limitation Law. See 35 ILCS 200/18-
185.

Local development
Page 10 of 48 tax incentives
The ‘but for’ test
Individual incentives are often validated and evaluated against a standard referred to as “but
for”: would this or a similar development have occurred but for the incentive given? Meeting
this standard is a statutory requirement of using tax increment financing, business
development districts, and Cook County incentive classification.
For example, a municipality could offer a property tax incentive to a developer to convert an
abandoned facility into a distribution center. In theory, because the facility would not have
contributed much toward the local tax levy without being redeveloped, the initial cost of the
incentive is largely neutral to the taxing districts and other taxpayers, and future economic
gains provide a net fiscal benefit. If the “but for” standard does not hold — if the recipient
would have located in the district anyway or if another developer would have invested in the
facility without assistance — then the incentive only constrains the tax base unnecessarily. This
would likely result in lower tax revenues or higher effective tax rates district-wide.
The “but for” test is difficult to evaluate in practice. Full visibility into a business’ priorities,
resources, and constraints is not always possible, and local government staff cannot know the
alternative futures of any specific parcel with certainty. Careful review of the developer’s
financial reports and the use of third-party advisory services can help. But the standard remains
elusive: recent research suggests that 75 percent or more of incentive use nationally does not
impact firm location decisions.
9
‘But for’ in communities facing market challenges
Market dynamics can substantially impact the incentive negotiation process. When adjacent
communities compete for growth, businesses may use their negotiating position to reap
benefits beyond those necessary to close financial gaps in their development plans. In this case,
passing the “but for” test becomes increasingly about outbidding peers, all of whom want to
generate development. Individual agreements may then meet this standard but nonetheless
remain suboptimal for communities, because more revenues or a larger tax base would have
been possible.
Disinvested communities in our region face particular market challenges. Taxing districts in
these areas often need to impose higher tax rates to balance their financial needs on a smaller
tax base. These conditions are likely to weaken their competitive position when negotiating
with businesses. Disinvested and lower-capacity communities may therefore offer more than
their wealthier peers to attract similar opportunities. Deals that provide greater incentives
relative to their promised benefits can decrease any project’s long-term contribution to the
community. Examples include an increase in incentive value relative to jobs created, the need
for large packages to recruit key community assets like grocery stores, or the inability to
negotiate for the mitigation of any negative side effects of growth. This dynamic hurts the
residents of under-resourced places and reflects larger, structural inequities in the region.
9
Bartik, “‘But For’ Percentages for Economic Development Incentives.”

Local development
Page 11 of 48 tax incentives
Other factors driving fiscal impact
Other factors also contribute to the net fiscal impact of incentive use. Local governments need
to balance potential new revenues with the costs of servicing any new development. Questions
need to be asked on a per-project basis. Local governments should determine whether the
development will raise tax revenues enough to cover new and existing costs without increasing
rates, whether expected spillover effects (like additional local due to new residents and jobs)
will materialize, and whether development will benefit current residents or newcomers.
10
The
impacts are also multijurisdictional: development, especially near municipal borders, may
provide benefits or create costs for neighboring taxing districts.
11
Local governments’ willingness to use incentives to compete within the region can also lead to
diminishing revenues if incentives become increasingly expected and incentive values get larger
over time. Research links this sort of competition to more incentive agreements and lower
public sector revenues,
12
and shows that both the number and average value of incentives have
increased over the last three decades.
13
Some incentives impact the tax base, not revenues
Sales tax rebates and property tax abatements impact final tax revenues: taxing districts that
offer these incentives collect less than those able to attract similar development without
incentives. Tax increment financing and Cook County incentive classification, on the other hand,
impact the property tax base by altering the equalized assessed value (EAV) that districts have
available to tax. Their effects are more complex, determined by how local growth patterns
interact with the structure of the Illinois property tax system.
Incentives that discount a property’s EAV can appear fiscally neutral to the taxing district
because they do not change its tax extensions or reduce tax collections. But actual fiscal
impacts depend on a new development’s net effect on public costs, even if the investment
would not have occurred but for an incentive. If the post-incentive increase in the tax base is
greater than the increase in related service costs, the result is lower property tax rates and bills
district-wide. If the incentive was not necessary to achieve comparable development or if the
cost of new services outpaces the gain in EAV, the result is higher rates and bills in the district.
10
One recent study finds that TIF districts in Illinois, for example, appear to have had a negative impact on job growth: Joshua
Drucker, Geon Kim, and Rachel Weber, “Did Incentives Help Municipalities Recover from the Great Recession? Evidence from
Midwestern Cities,” Growth and Change 50, no. 3 (September 2019): 894–925, https://doi.org/10.1111/grow.12318.
11
For additional analysis, see Chicago Metropolitan Agency for Planning, “Sales Tax Rebates Remain Prevalent in Northeastern
Illinois,” Policy Update, May 2016, https://www.cmap.illinois.gov/updates/all/-/asset_publisher/UIMfSLnFfMB6/content/sales-
tax-rebates-remain-prevalent-in-northeastern-illinois.
12
Stephan J Goetz et al., “Sharing the Gains of Local Economic Growth: Race-to-the-Top versus Race-to-the-Bottom Economic
Development,” Environment and Planning C: Government and Policy 29, no. 3 (June 2011): 428–56,
https://doi.org/10.1068/c1077r; Jia Wang, “Strategic Interaction and Economic Development Incentives Policy: Evidence from
U.S. States,” Regional Science and Urban Economics 68 (January 2018): 249–59,
https://doi.org/10.1016/j.regsciurbeco.2017.11.007.
13
Timothy J. Bartik, Making Sense of Incentives: Taming Business Incentives to Promote Prosperity (W.E. Upjohn Institute,
2019), 7–8, https://doi.org/10.17848/9780880996693; Donegan, Lester, and Lowe, “Striking a Balance,” 3.

Local development
Page 12 of 48 tax incentives
Overall incentive use in northeastern Illinois
Although local development tax incentives are used regularly across northeastern Illinois,
assessing their prevalence is difficult. Different structures, fiscal impacts, and reporting
requirements limit comparison across incentive types. Existing studies tend to focus on a single
type of tax incentive — for example, sales tax rebates or tax increment financing. However,
local governments may use different (or multiple) tools to pursue similar results: separate
incentive negotiations may lead to one community granting a property tax abatement and
another creating a TIF district to attract the same business. Comprehensive analysis can reveal
more about the full extent of incentive use and who uses which tools.
To provide this comprehensive analysis, this report assesses the market value of commercial
and industrial properties with tax revenues reduced, impacted, or restricted by any local
incentive. This approach uses the limited available data about incentives to provide an effective
basis for calculating rates of incentive use.
14
A parcel-level analysis allows for summaries across
any geography, and — because the dollar amount of each incentive deal is usually unavailable
and difficult to compare across incentive types — weighting properties by market value
approximates their relative significance and impact.
15
This approach has limits. First, it does not take into account the total size of incentive packages.
Second, it does not evaluate which incentive agreements in the region adhere to best practices,
such as including job quality, clawback, and reporting provisions. Third, it is not suitable for
making comparisons about the prevalence of TIF versus other incentive types, because the
manner in which TIF affects properties within a district is different from the other incentive
types. Analysis based on actual revenues collected and expended would provide better
comparisons, but the necessary data for this analysis are not consistently available.
How much are incentives used in northeastern Illinois?
Local development tax incentives impact tax revenues from 26.3 percent of commercial and
industrial development in northeastern Illinois, as measured by market value. Estimates are
driven by TIF districts, which are drawn to include 21.7 percent of the region’s commercial and
industrial properties. By comparison, 6.6 percent of business properties are incentivized
through a property tax abatement, Cook County incentive classification, or sales tax rebate.
16
While many communities incentivize a large portion of their commercial and industrial
14
This analysis combines publicly available data, third-party reporting, and information obtained through data use agreements
with other public agencies. Analysis uses data from each county’s assessor to estimate each property’s market value and land
use for tax purposes.
15
The use of market value-weighting assumes that the geographies in question have relatively internally consistent real estate
market dynamics (e.g., that land values are roughly constant within highly infill-supportive areas or within any specific freight
cluster) but does not require consistency across geographies.
16
Throughout this report, the total rate of incentive use is often slightly lower than the sum of its component parts (rates of use
of specific incentives) due to properties that are impacted by multiple types of incentives.

Local development
Page 13 of 48 tax incentives
properties, preferred incentive tools vary by location and reflect both historical development
patterns and current market pressures.
Figure 1 shows that Chicago currently has no sales tax rebates or property tax abatements but
has placed nearly 40 percent of commercial and industrial market value in a TIF district —
substantially more than the average for communities in the rest of the region. Incentive
classification is more prevalent in suburban Cook County (13.5 percent of business property)
than in Chicago (5.6 percent). Both sales tax rebates and property tax abatements are used
more heavily in the collar counties, where large-format, high-sales volume shopping centers
and vehicle dealerships make up a larger portion of total commercial and industrial market
value with incentives. Kendall County, home to the region’s lowest rate of TIF use, has the
highest rates of sales tax rebates and property tax abatements of any county. Property tax
abatements are the least prevalent region-wide, used for only $506 million of property value
(0.3 percent of the regional total).
Figure
1.
I
ncentive use differs across the region, with suburban communities using a wider variety of
incentive types
Share of commercial and
industrial property
market value affected by
local tax
incentives by
location, 2019-20
Note:
Totals reflect properties
that receive multiple incentives
.
Source: CMAP analysis of data
from county assessors, Illinois
Department of Revenue, and
other sources.
0%
10%
20%
30%
40%
50%
Sales tax rebate Property tax
abatement
Incentive
classification
Tax increment
financing
Any incentive
City of Chicago Suburban Cook County Collar counties

Local development
Page 14 of 48 tax incentives
Which communities are most likely to use incentives?
The vast majority of incentive use occurs within the region’s municipalities, reflecting their
regulatory and practical role in incentive agreements. Over $7 billion of the region’s commercial
and industrial property is in unincorporated areas, but only 0.3 percent of this property is
incentivized, compared to 27.4 percent in villages, towns, and cities. The most common tool in
unincorporated areas is incentive classification, as enabled by Cook County ordinance.
Several factors drive municipalities to use incentives and increase intraregional competition.
State revenue disbursement policies reward municipalities for attracting sales tax-generating
businesses. Public and private disinvestment in older job centers has resulted in a lower tax
base, higher tax rates, and difficulty attracting new development in some communities.
Property classification raises tax rates on commercial and industrial property in some areas of
Cook County relative to neighboring counties. And communities near Indiana and Wisconsin
face competition across state lines.
Of the 218 municipalities in the region that use incentives, the rate of incentivization ranges
from less than 1 percent of commercial and industrial market value up to 100 percent. Figure 2
shows that 29 communities incentivize more than 60 percent of their commercial and industrial
property; an additional 40 incentivize between 40 and 60 percent. Significant incentive use
appears throughout the region, but it is most common in south and west Cook County.
Greater use of incentives is associated with multiple indicators of economic disadvantage and
vulnerability. Figure 3 shows that as the rate of incentive use rises, median household income
and property tax base per capita decrease on average. Meanwhile, the percent of residents
living in communities with high concentrations of people of color with low income tend to
increase.
17
For example, only 7 of the 69 municipalities with over 40 percent incentivization
have median household incomes over $100,000, compared to 74 of the 213 municipalities with
a lower rate of incentive use. Although there is substantial variation across communities, these
findings suggest that the use of development incentives — and the negative impacts of long-
term reliance on them to achieve growth — is concentrated among lower-capacity and lower-
tax-base communities of color, where they may be used to offset structural challenges.
17
Measured using CMAP’s economically disconnected areas, an ON TO 2050 analysis that identifies census tracts with a higher
concentration of people of color with low income or non-English speakers with low income. See page 18 for more details about
this data.

Local development
Page 15 of 48 tax incentives
Figure
2.
The prevalence of
local tax incentives varies by municipality. Incentives impact a smaller
proportion of property in collar county communities, with some exceptions.

Local development
Page 16 of 48 tax incentives
Figure
3.
Higher incentive use is more prevalent in communities with lower incomes and larger
concentrations of residents of color
with low income
Average characteristics
of municipalities by
share of commercial
and industrial
property
market value affected
by local tax incentives,
2019
Note:
Analysis includes local
sales tax rebates, property tax
abatements, Cook County
incentive classification, and
tax
i
ncrement financing districts.
Averages are weighted by
population.
Economically
disconnected areas
are census
tracts with large concentrations
of residents of color
with low
income
and populations with
limited English proficiency
.
Source: CMAP analysis of data
from county assessors, Illinois
Department of Revenue, and
other sources.
What types of properties are incentivized?
Using incentives to encourage growth in targeted geographies — especially economically
distressed areas — may be a bright spot for incentive use.
18
ON TO 2050 calls for focusing
redevelopment in infill-supportive areas; in economically disconnected and disinvested areas;
and near existing freight assets. The plan identifies geographies to support these goals. This
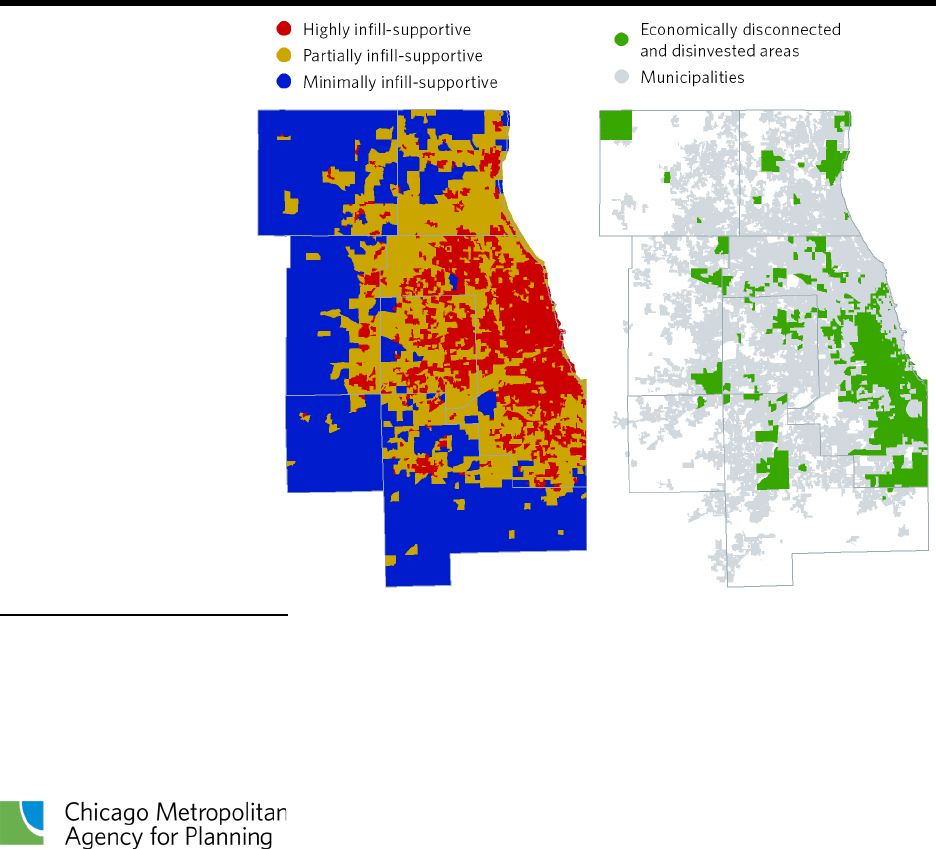
section analyzes incentive use in each of these three areas. Figure 4 shows the distribution of
infill supportiveness and economically disconnected and disinvested areas, while Figure 7 (page
21) identifies the region’s six freight clusters.
18
Bartik, “Who Benefits From Economic Development Incentives?”; Timothy J. Bartik, “Should Place-Based Jobs Policies Be
Used to Help Distressed Communities?,” Working Paper (Kalamazoo, MI: Upjohn Institute, August 1, 2019),
https://research.upjohn.org/up_workingpapers/308/; Joseph Parilla and Sifan Liu, “Examining the Local Value of Economic
Development Incentives: Evidence from Four U.S. Cities” (Metropolitan Policy Program at Brookings, 2018),
https://www.brookings.edu/wp-content/uploads/2018/02/report_examining-the-local-value-of-economic-development-
incentives_brookings-metro_march-2018.pdf.
$0 $20 $40 $60 $80 $100 $120 $140
No incentives
Under 39.9%
40.0% - 59.9%
Over 60.0%
Thousands of dollars
Median household income Property tax base per capita
0% 10% 20% 30% 40% 50% 60% 70%
No incentives
Under 39.9%
40.0% - 59.9%
Over 60.0%
Share of population in economically disconnected areas
Local development
Page 17 of 48 tax incentives
Infill supportiveness
Infill development is growth that occurs in areas already serviced by existing infrastructure, like
roads, water mains, and sewers. The construction and maintenance of this infrastructure are a
major expense for municipalities, and growth that requires new facilities is more likely to
generate ongoing future costs. Infill development can therefore generate higher net fiscal
benefits than projects in undeveloped areas.
19
Additionally, increased density from infill can
help to promote transit ridership, provide residents better access to jobs and services, and
reinvigorate older commercial corridors and residential neighborhoods.
20
In preparing ON TO
2050, CMAP conducted the baseline assessment of infill supportiveness shown in Figure 4,
placing every part of the region on a three-tier scale from minimally to highly supportive. As the
necessary infrastructure is built, development in areas that had less access to existing
infrastructure, housing, and jobs in 2000 is likely to contribute to ongoing new costs.
Figure
4.
Two g
eographic analyses completed for ON TO 2050 provide helpful bases for evaluating the
spatial
targeting of incentives
Infill supportiveness
and economically
disconnected
and
disinvested areas,
developed
for ON TO
2050
Note: Infill supportiveness
is a
baseline measure of
locations
with
sufficient infrastructure
like
roads and water systems in
2000
to support development.
Economically disconnected
areas are census tracts
that had
large concentrations of
residents of color
with low
income
in 2014. Disinvested
areas
are non-residential census
tracts that have experienced
declines of business investment
between
1970 and 2015. See
ON TO 2050 for additional
details.
19
Chicago Metropolitan Agency for Planning, “Fiscal and Economic Impact Analysis of Local Development Decisions,” January
2014, https://www.cmap.illinois.gov/documents/10180/82875/Fiscal+Econ+Impacts+Dev+FINAL.pdf.
20
Chicago Metropolitan Agency for Planning, “Reinvestment and Infill,” ON TO 2050 Strategy Paper, June 2017,
https://www.cmap.illinois.gov/documents/10180/517111/Reinvestment+and+Infill+Strategy+Paper/f075aca4-49d1-450a-9af5-
097bfdb12ac4.

Local development
Page 18 of 48 tax incentives
Figure 5 shows that incentive use is most prevalent in highly infill-supportive areas, with 31
percent of commercial and industrial market value impacted by at least one incentive type.
However, over 16 percent of development in minimally infill-supportive areas is also
incentivized. New construction near the region’s edge may be the right fit for certain growth
and may necessitate incentives due to site-specific challenges. But the use of tax incentives in
these areas may also contribute to development patterns that do not achieve regional goals.
Better economic development practices can help to reduce the climate impacts and financial
costs of transportation and conserve lands for critical agricultural and ecosystem services.
The prevalence of specific incentive tools varies substantially across these three tiers. Figure 5
shows that tax increment financing is the most common incentive tool in highly infill-supportive
areas, while other tools are more common in less developed parts of the region. In particular,
property tax abatements, which are relatively non-existent closer to the region’s core, are
much more common in areas identified as the least supportive of redevelopment and infill.
21
Figure
5.
Incentives are more prevalent in infill
-supportive areas near the region’s historic core, but a
sizeable amount of development in minimally
infill-supportive areas is incentivized as well
Share of total
commercial and
industrial property
market value affected
by local tax incentives,
by levels of infill
supportiveness,
2019-20
Note:
Totals reflect properties
that receive multiple
incentives.
Source: CMAP analysis of data
from county assessors, Illinois
Department of Revenue, and
other sources.
21
This report generally refrains from comparing actual incentivized market value across geographies, because market dynamics
and inequities in the appraisal industry contribute to substantially different valuations of property across the region. However,
more than twice as much commercial and industrial property (as measured by market value) in minimally infill-supportive areas
receives a property tax abatement than in partially and highly supportive areas combined, despite the presumption that the
value of like property decreases with greater distance from other dense existing development.
0%
10%
20%
30%
40%
50%
Sales tax rebate Property tax
abatement
Incentive
classification
Tax increment
financing
Any incentive
Highly supportive Partially supportive Minimally supportive

Local development
Page 19 of 48 tax incentives
Economically disconnected and disinvested areas
CMAP has defined economically disconnected areas (EDAs) and disinvested areas (DAs), where
local and state governments should concentrate investment to address the needs of vulnerable
populations and offset declines over time.
22
EDAs and DAs often face particular market
challenges that limit developer interest, including a high number of brownfield and dilapidated
properties. Targeted incentives can be an effective tool to close genuine neighborhood- and
property-specific financing gaps related to these issues.
Figure 6 shows that incentives are approximately twice as prevalent in EDAs and DAs as in the
rest of the region. This variation is driven by Chicago and suburban Cook County’s respective
use of tax increment financing and incentive classification. Both incentive types are about twice
as prevalent in these communities as in other, more advantaged areas. Incentive use is lower in
EDAs and DAs across the collar counties. Sales tax rebates are notably less present in EDAs and
DAs, where developers may overlook local purchasing power and where there has been less
retail investment historically.
Figure
6.
Local tax i
ncentives, particularly tax increment financing and incentive classification, are used
more frequently in economically disconnected and disinvested areas
Share of total
commercial and
industrial property
value affected by
local
tax
incentives in
economically
disconnected and
disinvested areas, 2019
-
20
Note:
Totals reflect properties
that receive multiple incentives
.
Source: CMAP analysis of data
from county assessors, Illinois
Department of Revenue, and
other sources
.
22
Chicago Metropolitan Agency for Planning, “Economically Disconnected and Disinvested Areas,” ON TO 2050, 2018,
https://www.cmap.illinois.gov/2050/maps/eda.
0%
10%
20%
30%
40%
50%
Sales tax rebate Property tax
abatement
Incentive
classification
Tax increment
financing
Any incentive
Economically disconnected and disinvested areas Other areas

Local development
Page 20 of 48 tax incentives
More contextual information about specific businesses and developments is needed to fully
evaluate the impacts of incentive use in vulnerable areas.
23
These patterns point to both the
challenges of revitalizing legacy commercial corridors and historic job centers, as well as the
need for structural reforms to support reinvestment. CMAP supports the strategic use of
incentives in these areas. Agreements should reward the creation of high-quality jobs and
target businesses prepared to be effective community partners or provide important local
services. But, as discussed on page 10, the negative consequences of widespread use of local
incentives can limit taxing districts’ long-term capacity to generate revenue. Other business
supports can pursue these goals without relying on the loss or redistribution of local revenues.
Freight clusters
Northeastern Illinois is the nation’s preeminent intermodal freight hub, with 10 interstate
highways, six of the seven Class I railroads, the top international air cargo hub by value in North
America, and the only direct maritime connection between the Great Lakes and the Mississippi
River network. Freight-reliant firms tend to co-locate around shared resources, and although
industrial lands with existing access to freight infrastructure are among the region’s most
significant assets, evolving economies and aging or outdated infrastructure create barriers to
their effective ongoing use.
24
Enhancing the competitiveness of the region’s freight network —
including bolstering productivity and business activity on freight-supportive land — is an
important regional goal. ON TO 2050 identifies six freight clusters to help direct strategic
investment in the freight network.
Figure 7 illustrates incentive use across these freight clusters. Unlike most of the other analyses
in this report, this map shows industrial property only. Industrial development in the freight
clusters outside of Cook County is between 10 and 20 percent incentivized, a rate much lower
than in clusters within Cook County. The heavy use of incentives in the core/Midway and south
Cook County freight clusters (92.5 and 89.1 percent, respectively) may reflect the area’s
structural challenges, such as higher tax rates, expensive redevelopment costs, or freight assets
in need of upgrades.
25
The use of fiscally prudent and well-structured incentives can help to
encourage investments in key components of the freight network, concentrate related
development near existing facilities, and mitigate the negative impacts of freight movement on
vulnerable populations. This analysis does not consider whether the incentives used in freight
clusters meet these goals or were necessary to promote development.
23
For example, incentivizing development in EDA/DA areas can revitalize older commercial and industrial corridors, provide
important amenities to neighborhoods where they are lacking, and create new employment opportunities proximate to
communities with higher-than-average unemployment and lower-than-average transit connectivity. On the other hand, new
development may also harm the communities in which they locate: some commercial and industrial growth may create new
sources of pollution and congestion, adding to existing environmental justice concerns; create jobs that are unsafe or do not
provide living wages or access to professional growth; or sell products that do not improve existing residents’ quality of life.
24
Chicago Metropolitan Agency for Planning, “Local Freight Clusters and Bottlenecks,” ON TO 2050, 2018,
https://www.cmap.illinois.gov/2050/maps/freight.
25
Industrial development in the Greater O’Hare freight cluster, located primarily in Cook and DuPage counties, is 42.1 percent
incentivized. Industrial development in the north Chicagoland, Will County, and Fox River Valley clusters are 19.7, 13.3, and
10.1 incentivized, respectively.

Local development
Page 21 of 48 tax incentives
Figure
7.
I
ncentive use for industrial development in freight clusters is greatest in legacy industrial areas
near the region’s core with existing access to freight facilities

Local development
Page 22 of 48 tax incentives
Use of specific incentives
Although it is important to assess the overall prevalence of local development incentives, each
incentive tool is enabled by distinct legislation, enacted in a specific manner, and unique in how
it impacts taxation. Different data are available for analysis due to the nature and structure of
different incentive types, as well as their disclosure requirements. This section documents
specific findings related to the use, context, and prevalence of each incentive type CMAP
studies: sales tax rebates, property tax abatements, Cook County incentive classification, and
tax increment financing.
Sales tax rebates
In Illinois, sales of most tangible goods are subject to state and local sales taxes, and part of the
revenue is disbursed to local governments. This structure has given rise to a development
incentive called a sales tax rebate, in which local governments are authorized to share a portion
of the sales tax revenue generated by a development back to individual businesses. There are
327 sales tax rebates currently active in northeastern Illinois.
Municipalities and counties can sign sales tax rebate agreements with retailers or developers.
26
Rebates can affect revenues from three categories of sales taxes: the local government’s share
of the state sales tax, any local option sales tax imposed by the county or municipality, and any
additional sales tax imposed in a business district (see box on page 9 for more information on
sales taxes). Without sufficient revenue options, some local governments use these incentives
to pursue sales tax-generating development to increase the total revenue they can collect. As a
result, these rebates often target high-value retailers, such as vehicle dealerships.
Public Act 97-0976 and the lack of information on sales tax rebate agreements
In August 2012, Illinois enacted Public Act 97-0976, which requires municipalities and
counties to report information on sales tax agreements to the Illinois Department of Revenue
within 30 days of execution. This includes the business location, the manner in which the
rebate amount will be determined, and the duration of the agreement, as well as a copy of
the agreement. Despite these requirements, the resulting database is inconsistent and
incomplete. Some agreements are missing entirely from the database. Other key details —
like total sales figures, the sales tax amount collected, and the final revenue amount rebated
— are redacted and exempt from the other public disclosure and transparency laws. Further
reforms are needed to ensure residents and researchers can access the data required to
accurately assess or evaluate sales tax rebates. More information on local governments’
reporting requirements is available at:
https://www2.illinois.gov/rev/questionsandanswers/pages/rebatesharing.aspx.
26
Illinois Municipal Code, 65 ILCS 5/8-11-21; Counties Code, 55 ILCS 5/5-1014.3

Local development
Page 23 of 48 tax incentives
Sales tax rebates use a wide range of terms to obligate funds
The region’s 327 active sales tax rebate agreements are located in 123 municipalities across
northeastern Illinois, according to data provided by municipalities to the Illinois Department of
Revenue (IDOR).
27
Around half of these records (180) have a maximum rebate amount listed in
the database or, in some cases, CMAP knew the maximum through past research. If every
business receives their maximum possible rebate, $447 million could be paid over the life of
these agreements. But actual totals could well exceed these estimates: 147 rebates either have
a maximum that was redacted or unreported in the IDOR database or have no maximum at all.
At least 10 municipalities have active agreements totaling more than $10 million, and 36 have
an agreement that will be in effect for more than 20 years with no known maximum.
The use of sales tax rebates has declined slightly in recent years, with some communities
foregoing new agreements as others have expanded their use. CMAP last analyzed the IDOR
database in 2015 and found 359 agreements across 132 local governments, with reported
maximums totaling $495.9 million.
28
Among the 58 municipalities in the region that executed
new agreements since 2015, three-quarters already had others in effect. By comparison, 24
local governments allowed all their rebates to expire without instituting new ones.
Although the terms can range widely, the typical sales tax rebate returns 50 percent of local
disbursements from the state’s sales taxes for 15 years or up to a specified maximum amount.
Although the lack of consistent public information makes it difficult to characterize their use in
great detail, available data do reveal a number of findings:
How long are the rebates available? All rebates specify a duration, which ranges widely
from two to 100 years. Three-quarters of agreements (242) have durations between 10
and 20 years, with 53 lasting more than 20 years.
Which taxes are rebated? The most common structure is to refund only revenues from
the local allocation of the state sales tax (83 agreements). Figure 8 shows that 63
agreements rebate a portion of the local option sales tax, either instead of or in addition
to those on the state taxes. This includes 19 records of municipalities committing to
rebate revenues from a business development district, as discussed later in this section.
However, 181 records in the IDOR database do not specify which tax will be rebated.
27
Analysis is based on IDOR data retrieved in November 2020, review of news articles about developments, and other
independent research. Analysis excludes sales tax sharing agreements between local governments.
28
Chicago Metropolitan Agency for Planning, “Sales Tax Rebates Remain Prevalent in Northeastern Illinois.”

Local development
Page 24 of 48 tax incentives
0 30 60 90 120 150 180
Local allocation of state sales tax Both state and local sales taxes
Local option sales tax Business district sales tax with other sources
No information
Figure
8.
Most sales tax rebate agreements share the municipality’s allocation of the state sales tax,
sometimes along with other taxes
Number of sales tax
rebate agreements by
type of tax
revenue
rebated, 2020
Note: A
ll agreements that
rebate business district sales
taxes also rebate
state or local
sales taxes.
Source: CMAP analysis of Illinois
Department of Revenue data.
How are the rebate amounts determined? In additional to specified maximums, slightly
over one-third of agreements (121) include minimum sales thresholds, where the rebate
does not begin until the local government first receives a certain amount of revenue.
Between any thresholds and maximums, local governments rebate anywhere from 25 to
100 percent of the sales tax subject to the agreement. Most agreements (144) offer 50
percent of taxes collected, while 101 agreements rebate more than half, including 27
that rebate all eligible taxes after any thresholds. Thirty records do not specify the
proportion rebated.
How many rebates include maximums? Because incentives are meant to close gaps in
developer financing, it is a best practice to cap rebates once the business has recouped
a set dollar amount. Figure 9 shows that 210 agreements include maximum rebate caps,
30 of which are redacted. Maximums range from $48,000 to $30 million, with an
average rebate of $2.5 million.
The benefits and costs of sales tax rebate agreements depend heavily on these terms. Like
other incentive types, sales tax rebates are tax expenditures — they effectively lower tax
revenues rather than increase public spending. Nonetheless, they are direct financial outlays to
private businesses and developers. Agreements with large terms or no maximum rebate
commit communities to providing funds that could reach well beyond those offered through
other incentive types.

Local development
Page 25 of 48 tax incentives
Figure
9.
Rebate maximums
— which average $2.5 million — limit local governments’ obligations to
refund sales tax revenue to businesses if their total sales rise
Maximum rebate
amounts of active sales
tax
rebate agreements
in
northeastern Illinois,
2020
Note: Analysis excludes 117
agreements where data
reported to
the Illinois
D
epartment of Revenue (IDOR)
mak
e no mention of a
maximum rebate and research
using other sources did not
reveal one. These rebates could
have no reba
te cap or caps that
are unreported.
Source:
CMAP analysis of IDOR
data
and other sources.
State tax structure encourages sales tax rebates for retail
The structure of Illinois’ tax and revenue disbursement system encourages communities to
pursue specific types of commercial development for fiscal gain. Municipalities in the region
collected $2.3 billion in sales tax revenue in fiscal year 2019, about 17.5 percent of all municipal
revenues.
29
Local governments in Illinois do not have the authority to impose a local income
tax, and Illinois’ narrow sales tax base is focused on tangible goods and few services, which is
out of sync with increasing market demand for consumer services.
30
Together, these issues
leave many municipalities — especially communities without significant sales tax-generating
development, and those with weak property values and already high property tax burdens —
with few stable options for gathering revenue.
31
29
CMAP analysis of Illinois Office of the Comptroller data. Analysis includes only general, special revenue, capital project, and
debt service funds.
30
Chicago Metropolitan Agency for Planning, “The Benefits of Adding More Services to Illinois’ Sales Tax Base,” Policy Update,
March 2019, https://www.cmap.illinois.gov/updates/all/-/asset_publisher/UIMfSLnFfMB6/content/the-benefits-of-adding-
more-services-to-illinois-sales-tax-base.
31
Chicago Metropolitan Agency for Planning, “Tax Policies and Land Use Trends,” ON TO 2050 Strategy Paper, March 2017,
https://www.cmap.illinois.gov/documents/10180/517351/Tax+Policy+and+Land+Use+strategy+paper/30b90429-1af9-4903-
ad29-b75ed1dc94e0.
0
10
20
30
40
50
$500,000 and
lower
$500,001 -
$1,000,000
$1,000,001 -
$2,000,000
$2,000,001 -
$5,000,000
$5,000,001 -
$30,000,000
Redacted
maximum

Local development
Page 26 of 48 tax incentives
Tax collections from retail businesses and other commercial developments tend to exceed the
cost of servicing them and provide greater fiscal benefits than other property types like office
or industrial sites.
32
Without greater revenue options, state policies reward municipalities for
actively recruiting sales tax-generating businesses within their borders, including by offering
sales tax rebates.
33
This can lead to high levels of retail vacancy and lower overall sales tax
collections due to intraregional competition. Figure 10 shows that municipalities with active
sales tax rebate agreements are typically 10 percentage points more reliant on sales tax
revenues than those without agreements.
The types of businesses receiving sales tax rebates provide further evidence that agreements
tend to promote development that provides more fiscal than economic benefits. Figure 11
indicates that one-third (115) of sales tax rebates go to vehicle dealerships, where high-value
sales can have a large impact on the size of a municipality’s share of state sales tax.
34
Figure
10.
Local governments with active
sales tax rebate agreements are typically 10 percentage points
more reliant on sales tax revenues than those without agreements
Range of municipal
reliance on sales tax
revenue by use of sales
tax rebates, 2019-20
Note: Analysis reflects data
from the
278 of northeastern
Illinois’ 284 municipalities with
sufficient data available.
Source: CMAP analysis of Illinois
Office of the Comptroller and
Illinois Department of Revenue
data.
32
Chicago Metropolitan Agency for Planning, “Fiscal and Economic Impact Analysis of Local Development Decisions.”
33
In 2015, 60 percent of active rebates in suburban areas were given to developments located on or near a municipal border,
compared to 47 percent of all retail businesses. Chicago Metropolitan Agency for Planning, “Sales Tax Rebates Remain
Prevalent in Northeastern Illinois.”
34
Illinois statute does not enable local option sales taxes on titled or registered purchases, so competition for vehicle
dealerships only impacts disbursements of the state sales tax to municipalities. Local governments can implement a use tax on
titled purchases, but this tax is collected based on the purchaser’s home address, not purchase location.
72.6%
62.4%
19.8%
32.1%
7.1%
16.5%
12.4%
22.2%
0%
25%
50%
75%
No active agreements Active agreements
How to read this chart
Maximum
75th percentile
Median
25th percentile
Minimum

Local development
Page 27 of 48 tax incentives
Another 171 rebates (more than half) are awarded to retail establishments like shopping
centers, gas stations, grocery stores, drug stores, and restaurants. Rebates with the highest
maximums also tend to subsidize vehicle dealerships or entire shopping centers.
Although sales tax-generating businesses like grocery or hardware stores can offer important
local amenities, those businesses would mostly exist in the area regardless of incentives
because residents buy these products locally. Municipalities offer sales tax rebates intending to
impact which local government within a market area can collect sales taxes, but not whether
the amenities and tax revenue will exist in that area.
35
These businesses also provide smaller
economic spillovers — such as increased local spending or hires that result from new business
activity — than other firms, like those in manufacturing, transportation and logistics, or
professional services. For example, manufacturers in northeastern Illinois provide an average
wage ($79,200) nearly double that of retailers ($38,500) and regularly source materials and
component parts within the region, helping to localize direct and indirect spending.
36
Figure
11.
Sales tax rebates are
principally awarded to retail and vehicle dealerships
Number of active sales
tax
rebate agreements
by type of business or
development, 2020
Source: CMAP analysis of Illinois
Department of Revenue data
and other sources.
These data show how sales tax-driven economic development can drive diminishing returns
unless they are carefully targeted. The increasing use of sales tax rebates may benefit specific
businesses without providing net benefits to the region or its residents. This happens when
rebates reduce tax revenues, when intraregional competition undermines the apparent fiscal
35
Chicago Metropolitan Agency for Planning, “Examination of Local Economic Development Incentives in Northeastern Illinois,”
August 2013, https://www.cmap.illinois.gov/documents/10180/82875/FY14-
0009+LOCAL+ECONOMIC+INCENTIVES+REPORT.pdf.
36
CMAP analysis of Economic Modeling Specialists International data (Emsi 2021.2).
Vehicle
dealerships
115
Sales and
distribution offices
33
Other
8
Retail
171

Local development
Page 28 of 48 tax incentives
benefits to municipalities with retail development, and when recipients would have located in
the area anyway due to existing market factors.
Sales tax rebates also operate in business development districts
State statute authorizes municipalities to designate business development districts (BDDs),
impose additional sales taxes within them, and rebate the collected tax, among other eligible
uses. Per statute, rebates should reimburse project costs that conform to the BDD’s adopted
redevelopment plan.
37
Twelve municipalities have reported 19 rebate agreements to the Illinois
Department of Revenue (IDOR) that draw from business district sales taxes.
Sales tax rebates in BDDs generally reflect standard sales tax agreements in terms of durations,
sales thresholds, and caps. But they also differ in important ways. They are more likely to return
all of the applicable sales tax revenues that a recipient originates — 12 of the 19 agreements
rebate 90 to 100 percent — and are more likely to draw on multiple revenue sources to pay
businesses or developers. Agreements in BDDs also target more substantial redevelopment
projects: half of the reported agreements are for large shopping centers or adjacent gas
stations, drug stores, and large-format grocery stores.
How prevalent are business development districts?
Use of business district sales taxes has grown rapidly over the past decade. Thirty
municipalities in northeastern Illinois collected $10.7 million across 46 districts in fiscal year
2020, tripling the $3.4 million received by just nine municipalities in fiscal year 2012. This can
be a source of ample revenue over time, with districts in the region averaging around
$229,000 per year since 2007. This could amount to $7 million over their 23-year allowed
lifespan, if revenues grew 2.5 percent annually.
37
BDDs are similar in statutory intent and function to tax increment financing districts, with parallel requirements on criteria,
including qualifying blighted areas, preparation of a redevelopment plan, a maximum term of 23 years, and eligible expenses,
among others. But the statutory process to establish a BDD is generally less stringent because it does not affect the collection
or distribution of property taxes, nor the tax base of other units of governments. See 65 ILCS 5/11-74.3 and 74.4.

Local development
Page 29 of 48 tax incentives
Property tax abatements
Any Illinois district that extends a property tax can reduce this tax for certain properties. Most
abatements take a specified percent off the final tax bill for a period of years, with the discount
staying flat over time or decreasing annually. The most common property tax abatements are
statutorily limited to $4 million and 10 years. Abatements are less common than other types of
local incentives in the region.
38
The box below summarizes different types of abatements that
are authorized in the Illinois Property Tax Code.
39
Although municipalities or counties often take a lead in working with businesses and
developers on new economic development projects, individual taxing authorities must approve
property tax abatements. Municipalities often represent a relatively small portion of properties’
overall tax bill, so businesses and developers often solicit abatements from multiple local taxing
districts at once.
Property tax abatement eligibility
State statute enables property tax abatements in various contexts. Property currently eligible
for abatements include:
40
Up to $4 million over 10 years for any commercial or industrial firm’s property. The
abatement period may be renewed if the firm had originally expanded its facility or
increased the number of employees.
Up to $4 million over two years for a business that locates in a facility that was vacant
for at least two years.
Up to $12 million over 20 years for commercial or industrial development of at least
500 acres or those of at least 225 acres designated as a high impact business.
Any amount over 10 years for a property located in a business corridor created by an
intergovernmental agreement between two adjoining disadvantaged municipalities.
Any amount over 10 to 15 years for qualifying facilities owned by an electric vehicle,
vehicle component, or vehicle power supply manufacturer and subject to a state
incentive agreement.
38
Municipalities in Cook County tend to use incentive classes as an alternative way to achieve a similar outcome for recipients
(lower property tax bills) with significantly different fiscal implications for local governments.
39
See 35 ILCS 200/18-165, 35 ILCS 200/18-184.5, 35 ILCS 200/18/184.10, and Illinois Public Act 102-0669.
40
Some abatements can be granted under other circumstances, including horse and auto racing facilities; academic and
research institutes; affordable senior and low-income housing; new single-family residential buildings in an “area of urban
decay”; properties in Enterprise Zones or River Edge Redevelopment Zones; and properties subject to annexation. Authority to

Local development
Page 30 of 48 tax incentives
Abatements are concentrated in a few communities, primarily for
industrial uses
In 2019, 48 businesses and developers received just over $5 million in total abatements for the
year. The typical agreement includes a 50 percent reduction in annual property taxes, with
many abating as much as 95 to 100 percent. On average, recipients — most often industrial
properties — paid $104,000 less than they would have in 2019 due to the incentive, although
the actual abated amount ranges from a few hundred dollars to $625,000 for the year.
41
Some
agreements also specify commitments in exchange for the abatements, such as minimum
capital investments, new or retained jobs, or square footage of completed improvements.
Industrial properties represent more than 81 percent of the market value of all properties with
abatements but 55 percent of the total abated tax payments. Non-industrial abatements
accounted for fewer agreements (20 out of 48), but the abatement amount tended to be higher
on average. Other types of properties with abatements included nursing home and senior
facilities, retail establishments, movie theaters, and hotels.
Although property tax abatements are not particularly prevalent in the region, their use tends
to be concentrated in communities that favor them over other incentive types. These
agreements are present in just 22 municipalities within the region, and four municipalities
account for nearly half of the 48 agreements. Country Club Hills, Joliet, University Park, and
Wilmington together provided 21 abatements totaling $1.9 million in 2019.
Although municipalities typically lead the incentive negotiation process, they are only one of
many taxing districts with a property tax levy, and larger incentives can be assembled by
arranging simultaneous rebates from multiple districts. Twenty of the 48 abatement incentives
include abatements from multiple districts. These incentives are on average more than three
times the size of single-district abatements.
Because school districts account for the largest share of the overall property tax extension in
the region, they can often offer the largest property tax abatements. School districts are
sought-after partners in abatement negotiations: all but one multi-district abatement includes
at least one elementary, unit, or high school district, and over 20 percent of single-district
agreements were abatements made by school districts. Of the 64 taxing districts with active
abatements in 2019, 28 were school districts compared to 15 municipalities and two counties.
provide abatements to certain corporate headquarters relocating from out of state expired August 1, 2006, but since the
abatement period could last up to 20 years, some may remain active.
41
Small abatements may be a function of development (or reassessment of new development) that has not yet occurred.
Percentage-based property tax abatements — which account for the vast majority of the region’s abatements — become
increasingly valuable as the assessed value of the incentivized property increases.

Local development
Page 31 of 48 tax incentives
Cook County incentive classification
Cook County uses a property assessment approach that differs from the rest of Illinois,
assessing commercial and industrial properties at a higher rate than other property. This system
has led to the practice of designating incentive classifications for certain eligible properties to
provide reduced assessment ratios, lower taxable values, and smaller tax bills for a fixed period
of time. The use of incentive classification is significant and expanding in Cook County. This tool
is used primarily to spur investment in industrial lands and disinvested communities.
Classification drives the use of incentives to reduce tax burdens
Property classification in Cook County results in larger tax bills for businesses and smaller bills
for owners of residential property. The extent of this shift varies across the county based on the
breakdown in each taxing district between commercial or industrial property value and other
property value, like residential; in many communities, the impact can be significant.
42
In parts
of suburban Cook County, commercial and industrial properties experience substantially higher
effective tax rates — usually greater than 5 percent and sometimes above 10 percent — than
residential properties, which typically have rates below 5 percent.
43
This burden shift does not
exist in the collar counties, driving a differential that can adversely affect businesses.
The substantial prevalence of incentive classification reflects the challenges created by the
county’s approach to property assessment. Higher assessment ratios — and higher effective tax
rates — for businesses drive the use of incentive classes to support certain commercial and
industrial properties. Doing so counteracts the systemic challenges unevenly and inconsistently:
the select commercial and industrial properties with incentive classification can contribute to
an overall decrease in the local tax base, resulting in higher tax rates district-wide and a shift in
tax burden onto other property owners. These rate changes will vary based on the land use
makeup of the district and the percentage of properties receiving incentive classification.
Industrial development receives most incentive classification
In 2019, 8.8 percent of the county’s total market value in commercial and industrial properties
received a Class 6b, 7a, 7b, 8, or C incentive classification.
44
Most municipalities (95 out of 134
total), as well as portions of unincorporated Cook County, use these tools. The practice has
grown since 2016, when CMAP estimates 7.2 percent of the county’s commercial and industrial
market value had been incentivized across 88 municipalities, as well as unincorporated areas.
45
42
Changing the assessment ratio for an individual property lowers both that property’s EAV and districts’ total tax base. For this
reason, the impact of classification on final tax bills depends not just on the class of the individual property but also on the
proportion of high-assessment ratio to low-assessment ratio properties in each district.
In taxing districts where property
assessed at one ratio predominates, property assessed at another ratio experiences large distortions in final tax bills, while the
predominant classification experiences little change. Because every property sits in multiple taxing districts, the impact of
classification on any given property is a sum of the impacts of classification for each district.
43
Effective property tax rates are property tax extensions as a percentage of market value, rather than EAV, allowing for
comparison across counties and property classes.
44
This analysis is based on 2019 classification and assessment data from the Cook County Assessor’s Office.
45
CMAP analysis of 2016 Cook County tax code data.

Local development
Page 32 of 48 tax incentives
Understanding standard and incentive property classes in Cook County
Illinois statute requires all propert
market value for the purposes of taxation, with the exception of property in counties with
more than 200,000 residents.
46
These counties are authorized by the state constitution of
1970 to apply different assessment ratios based on the type of property.
47
Cook County,
which assesses commercial and industrial property at a higher percentage of market value
than residential property, is the only county in the state that uses this assessment approach.
The Cook County Assessor’s Office (CCAO) assigns each parcel in the county to a property
class based on its use. To receive a reduced assessment ratio via incentive classification (one
of the shaded rows in the table below), the property owner must file an application with the
CCAO and, in some cases, the Bureau of Economic Development. The governing board in the
municipality where the property is located (or the Cook County Board of Commissioners in
unincorporated areas) must adopt an ordinance or resolution expressing its support and
certifying that the incentive is necessary for development. Although incentive classification
affects the tax base for every taxing district that extends a relevant property tax, like school
districts and townships, only municipalities and the county are involved in the decision to
issue an incentive classification. Other districts do not have the option to formally approve or
deny the incentive.
Class
Description
Assessment ratio
1
Vacant
10%
2
Farmland, single-family residence, multi-family residential with six units or fewer,
and mixed-use commercial and residential building with six units or fewer and
smaller than 20,000 square feet
10%
3
All other multi-family property
10%
4
Not-for-profit
20%
5a
Commercial
25%
5b
Industrial
25%
6b
Industrial development incentive
10%*
C
Industrial or commercial incentive for brownfield redevelopment (not renewable
for commercial)
10%*
7a
Commercial development incentive for projects with total development costs,
exclusive of land, not exceeding $2 million
10%*
7b
Commercial development incentive for projects with total development costs,
exclusive of land, over $2 million
10%*
8
Commercial or industrial incentive for development in areas in need of
revitalization
10%*
9
Multi-family housing incentive for new or redeveloped buildings with 35 percent
of units leased at rents affordable to low- or moderate-income persons
10%
S
Multi-family incentive for Section 8 contracts to provide federal rental subsidies
10%
L
Landmark incentive (not renewable for commercial)
10%*
10
Licensed bed and breakfast with six units or fewer
10%
Note: Some incentive classifications can be renewed. Marked incentive classifications are assessed at 15 percent in
year 11 and 20 percent in year 12
, after any approved 10-year renewals.
Source: Cook County Code of Ordinances §74-63 and §74-64

Local development
Page 33 of 48 tax incentives
An outsized share of properties with incentive classification are industrial properties, as
illustrated by Figure 12. Industrial property makes up only 1.2 percent of market value in the
county, but a substantial majority of it (84.3 percent) receives an incentive classification.
Commercial property represents 17.2 percent of the county’s total value — over 14 times more
than industrial — but only 3.2 percent of it is in an incentive class.
48
In all, industrial lands
account for 66.8 percent of non-residential incentive classification (Class 6b, C, and 8), while
commercial development accounts for the remaining one-third (Class 7a, 7b, and 8).
Much of the development receiving an incentive classification is in Cook County’s freight
clusters, which see high levels of other incentives as well (see page 20). This focus on industrial
lands can also be seen in the breakdown of municipalities that use reduced assessments.
Communities with extensive industrial lands close to major freight facilities tend to have high
concentrations of manufacturers, distribution warehouses, and similar developments, including
21 municipalities where industrial properties make up at least 5 percent of the total tax base.
These heavily industrial communities tend to incentivize nearly all of the related market value
Figure
12.
Although industrial properties compose a small percentage of total development in Cook County
by market value, they make up two
-thirds of property with an incentive classification
Share of market value
of Cook County
properties with
industrial and
commercial incentive
classes by
class and land
use, 2019
Note: Commercial and
industrial properties are both
eligible for Class 8 incentives.
Land use
is estimated based on
available data.
Source: CMAP analysis of Cook
County Assessor’s Office data.
46
35 ILCS 200/9-145
47
The highest assessment ratio cannot exceed 2.5 times the lowest rate. See the Illinois Constitution, art. IX, sec. 4.
48
Residential property represents 80.7 percent of the county’s total property value, with other classifications making up less
than 1 percent. Class 8 incentives are available for both commercial and industrial properties. This analysis uses information in
county assessor data to estimate the distribution of Class 8 incentives across commercial and industrial land uses.
Class 7b
Class 7a
Class 8
Class C
Class 6b
Commercial
Industrial

Local development
Page 34 of 48 tax incentives
— 16 have provided reduced assessment on 80 percent or more of their industrial property by
value. In contrast, no municipality provides incentive classification to more than half of its
commercial market value.
Figure 13, which compares the total market value of industrial development in incentive classes
by municipality and Chicago community area, closely mirrors the county’s distribution of
industrial land. The figure reveals that incentive classification is most commonly used in three
categories of communities. One group consists of communities near O’Hare International
Airport, including Elk Grove Village, Franklin Park, Melrose Park, and Northlake, as well as
industrial lands in Chicago. A second group is centered along Interstate 55 and the Chicago
Sanitary and Ship Canal, including municipalities with few residents, like Hodgkins, Bedford
Park, and McCook, and extending into Chicago’s historically industrial Near West Side. Both sets
use Class 6b incentives extensively. A third group includes municipalities across Cook County’s
south suburbs, like Sauk Village, Harvey, Ford Heights, and South Holland, which tend to rely
more on Class 8 incentives for revitalizing legacy industrial areas and are discussed more below.
Disinvested communities use incentive classification heavily
Incentive classification is also concentrated in Cook County communities facing structural
challenges that hinder development and job creation. These challenges include high
commercial and industrial property tax rates relative to both the region overall and neighboring
communities, which may vie for similar economic growth. Effective composite commercial and
industrial property tax rates rise to more than 7.5 percent in large portions of Cook County —
particularly in the south and west suburbs — compared to less than 5 percent in much of the
collar counties.
49
For most communities, CMAP has found that just over half of this non-
residential tax burden is a function of the burden shift inherent in the classification system.
50
And the impact is stronger in areas with fewer non-residential properties, including historically
industrial communities with vacant industrial lands and little commercial development.
49
Chicago Metropolitan Agency for Planning, “Property Tax Burden in the Chicago Region,” Policy Update, November 2017,
https://www.cmap.illinois.gov/updates/all/-/asset_publisher/UIMfSLnFfMB6/content/property-tax-burden-in-the-chicago-regi-
2.
50
Chicago Metropolitan Agency for Planning, “Cook County Property Tax Classification Effects on Property Tax Burden.”

Local development
Page 35 of 48 tax incentives
Figure
13.
T
he predominant locations of industrial incentive classifications by total market value are in
already heavily industrial areas near
O’Hare and the Chicago Sanitary and Ship Canal

Local development
Page 36 of 48 tax incentives
These conditions have led to the heavy use of incentive classification in the south suburbs, as
described in Figure 14. These communities primarily rely on the Class 8 revitalization incentive,
which by ordinance is available only in certain areas: Bloom, Bremen, Calumet, Rich, and
Thornton townships; designated “enterprise communities”; and other areas certified as in need
of revitalization.
51
On average, Class 8 incentives account for three-quarters of incentive
classifications by value in eligible suburban municipalities, with the rest largely going to Class 6b
properties.
52
These communities tend to incentivize more of their total commercial and
industrial market value (across all incentive classes) than the region as a whole — 16.4 percent
versus 12.9 percent in suburban communities that do not use Class 8.
The prevalence of incentive classification in these communities reinforces the need for greater
economic supports in disinvested parts of Cook County. But incentive classification is often
insufficient to overcome market weakness and least useful in the very communities that need
more support. Incentives that decrease properties’ equalized assessed value (EAV) are
functionally limited in their ability to attract economic growth. If incentive classification reduces
taxing districts’ total tax base relative to their extension, the agreements can result in higher tax
rates on other taxpayers in the district.
Effective tax rates and local revenues are buoyed by a community’s total taxable property
value. Significant use of incentive classes in a small area can begin to approximate the local
effects of phasing out the classification system entirely, by bringing assessment ratios more in
line across property types. But increasing use can also raise effective rates for existing business
users, whether or not they receive incentives, when it reduces the community’s total EAV
relative to their extensions.
53
In other cases, incentive classification can result in
redevelopment that increases total EAV and lowers effective rates, but the fiscal benefits will
be less than in communities with stronger markets that can achieve similar growth without
incentives.
Structural solutions can better and more permanently enable reinvestment. Gradually phasing
out Cook County’s classification system could reduce commercial and industrial property tax
rates in many lower-capacity communities, making them more attractive for development.
Other structural solutions — such as increasing revenue options for local governments in
disinvested areas to reduce reliance on property tax and other local taxes, reforming
disbursement models for state funding to municipalities, and reducing local government costs
by pursuing local partnerships — can also reduce tax burdens and advance the region’s
economic development goals.
51
Cook County Code of Ordinances §74-63 (12)a
52
In addition to municipalities in the south suburbs, Class 8 revitalization incentives are used in Cicero, Evergreen Park, and
Maywood, as well as parts of Chicago.
53
The more property in any taxing district receiving an incentive classification, the lower the district’s total tax base. A lower tax
base relative to the local tax extension increases tax rates for all taxpayers, even those with incentive classes.

Local development
Page 37 of 48 tax incentives
Figure
14.
Commercial and industrial incentive classification
— as a share of all commercial and industrial
market value
— is most prevalent in south and west Cook County, particularly in the townships
specified in county ordinance as eligible for the Class 8 revitalization incentive

Local development
Page 38 of 48 tax incentives
Tax increment financing
Tax increment financing (TIF) is used to fund improvements in blighted areas or conserve areas
that may become blighted. Establishing a TIF district freezes assessed property values in a
defined area, fixing the tax base at a set level. Taxing authorities apply their extensions against
this frozen base, while revenue collected on any incremental EAV — that is, any new taxable
value that did not exist in the TIF district when it was established — flows to the TIF district. TIF
districts can exist for up to 23 years. In northeastern Illinois, 21.7 percent of the region’s
commercial and industrial property is currently located within a TIF district.
Communities use TIF in a long-term bid to improve property tax base
Once raised, TIF funds can be used to finance projects that, in principle, increase property
values in the area. They may be used to directly fund development efforts undertaken by the
public sector, reimburse eligible project costs of private developers, or service bonds that fund
development. Among other expenses, TIF collections can pay for property acquisition, site
preparation, improvements to private or public buildings, public works, debt service, job
training, or related professional services.
These TIF funds are expended to implement an approved redevelopment plan. Redevelopment
plans and TIF district maps are adopted by the municipality’s governing board. Prior to
approval, the municipality must convene a joint review board consisting of representatives
from each taxing district that has authority to levy property taxes within the proposed TIF
district, as well as a member of the public. The joint review board considers the proposed
district geography and redevelopment plan before making an advisory recommendation to the
municipality’s governing board. If the joint review board rejects the TIF, the municipality’s
board must take a three-fifths vote to override the recommendation.
54
For many municipalities, TIF functions as a budgeting tool to dedicate funds for specific
purposes. Once a TIF expires, any new property value that was generating property tax revenue
for the district becomes available to the applicable taxing districts, enlarging their tax base. But
the impacts of a TIF district on economic development and local government fiscal status can
range substantially. The results are highly dependent on how much money the district can raise
and how the eventual projects and expenditures contribute to the area.
55
54
65 ILCS 5/11-74.4-5
55
Some research suggests that because municipalities tend to control related spending, TIF enables competition for the tax
base between overlapping local governments as value gains are typically unavailable to other taxing districts, such as school
districts (known as “vertical competition”). Furthermore, if tax extensions rise due to inflationary costs or service expansion
while base EAV is “frozen,” tax rates for impacted taxing districts will likely rise. See: Rachel Weber, Rebecca Hendrick, and
Jeremy Thompson, “The Effect of Tax Increment Financing on School District Revenues: Regional Variation and
Interjurisdictional Competition,” State and Local Government Review 40, no. 1 (December 2008): 27–41,
https://doi.org/10.1177/0160323X0804000103; Eric Stokan and Aaron Deslatte, “Beyond Borders: Governmental
Fragmentation and the Political Market for Growth in American Cities,” State and Local Government Review 51, no. 3
(September 2019): 150–67, https://doi.org/10.1177/0160323X20915497; Joshua Drucker et al., “Do Local Governments Use
Business Tax Incentives to Compensate for High Business Property Taxes?,” Regional Science and Urban Economics 81 (2020):
103498, https://doi.org/10.1016/j.regsciurbeco.2019.103498.

Local development
Page 39 of 48 tax incentives
The fiscal impacts of TIF use are particularly complex
The impacts of tax increment financing are difficult to predict or evaluate. TIF districts are intended to
generate new revenue by increasing the value of real property within the district — without
significantly impacting the finances of overlapping taxing districts. Other outcomes are possible,
including the three described below. Complex actions not described here, like transferring funds
between districts, further complicate the fiscal impacts of TIF. These varied possibilities reinforce the
need for thorough district planning, targeted spending, transparency, and other best practices.

Local development
Page 40 of 48 tax incentives
More communities are allocating property into TIF districts
Approximately two-thirds of the region’s municipalities (181 out of 284) had 612 active TIF
districts as of 2019.
56
This represents an increase of 35 more communities with active districts
— and 189 more districts — than were active in 2002. Use of TIF is concentrated toward the
region’s urban core: 37.5 percent of Chicago’s commercial and industrial property, as measured
by estimated market value, is located within a TIF district. This ratio is 21.1 percent in suburban
Cook County and 10.3 percent in the six collar counties.
Where and why can TIF districts be established?
Tax increment financing is enabled by the Tax Increment Allocation Redevelopment Act.
57
TIF
districts may be established in blighted areas or conservation areas that may become
blighted, as well as in areas near certain underused assets. The statute specifies conditions
that define each of these areas.
Improved areas must meet at least five of the following criteria defined in statute to be
considered a blighted area: dilapidation, obsolescence, deterioration, presence of structures
below minimum code standards, illegal use of individual structures, excessive vacancies,
inadequate utilities, excessive land coverage and overcrowding of structures, deleterious
land use or layout, lack of community planning, need for environmental remediation, and
decline in property values, as well as a lack of ventilation, light, or sanitary facilities. To be
considered a conservation area, at least half of the existing structures must be at least 35
years old, and the area must meet at least three of the above criteria.
Vacant areas can qualify as blighted by meeting two of the following criteria defined in
statute: obsolete platting, diversity of ownership of parcels, tax delinquencies, deterioration
of structures in neighboring areas, need for environmental remediation, and decline in
property values. Alternatively, vacant land can also be eligible if it qualified as a blighted
improved area before becoming vacant, is subject to chronic flooding, or has an unused
quarry, mine, rail yard, rail track, railroad right-of-way, or disposal site.
Areas that do not meet the above criteria can be eligible for TIF designation if they meet
other specific requirements, such as an industrial park in an area with a labor surplus. A labor
surplus municipality has had, at some point during the preceding six months, an
unemployment rate that is more than 6 percent and at least twice the national average.
56
Analysis is based on IDOR reporting from tax years 2002 through 2019 and tax code data obtained from each of northeastern
Illinois’ county governments. Analysis excludes Chicago’s Red-Purple Modernization TIF, which relies on 65 ILCS 5/11-74.4-3.3
to authorize value capture to finance significant transit improvements in certain contexts.
57
65 ILCS 5/11-74.4. The Industrial Jobs Recovery Law (65 ILCS 5/11-74.6) also enabled TIF districts under distinct criteria, but
these provisions have expired.

Local development
Page 41 of 48 tax incentives
Figure
15.
Tax increment financing is prevalent in municipalities all around the region, with 46 municipalities
includ
ing 40 percent or more of their commercial and industrial property value in a TIF district

Local development
Page 42 of 48 tax incentives
Some municipalities have dedicated an ample share of their property tax base to generating TIF
revenues. Figure 15 illustrates that within the region, 17 communities have enacted TIF districts
that include more than 65 percent of their commercial and industrial property (as measured by
market value); another 29 have placed between 40 and 65 percent within TIF districts. The
median market value in TIF districts among communities that use them is 19.1 percent.
Many suburban TIF users can be grouped into one of three distinct categories. Most
municipalities with the highest rates of TIF use are smaller, primarily residential communities
that have placed most or all of their limited commercial and industrial land in a single TIF
district. Another set of TIF users are communities with substantial industrial development.
Although communities in the first two groups exist all around the region, a third group of
communities — primarily medium size with mixed land uses — are located in south and west
Cook County.
Municipalities differ in their ability to raise TIF funds
In 2019, 5.9 percent of the region’s total property tax base — nearly $17 billion of EAV —
resided in TIF increments. This enabled total TIF property tax extensions to surpass $1.3 billion
in 2019. In real, inflation-adjusted terms, this more than doubles the $658 million raised in
2002. Although annual revenues fell between 2007 and 2014 as markets recovered from the
prior recession, Figure 16 shows that they have grown steadily in recent years. In total, TIF
districts collected more than $17.8 billion (adjusted for inflation) during 2002-19.
Figure
16.
The annual property tax extensions of TIF districts in northeastern Illinois have more than
doubled over the past 18 years, driven in part by Chicago
Total annual property
tax extensions of TIF
districts by location,
2002
-19, in millions of
2019 dollars
Note:
The extended central
business district includes
approximately the area bound
by North Avenue, Interstate 55,
Interstate 90/94, and Lake
Michigan.
Analysis excludes
Chicago’s Red
-Purple
Modernization TIF.
Source: CMAP analysis of Illinois
Department of
Revenue data.
$658
$1,188
$784
$1,346
$0
$200
$400
$600
$800
$1,000
$1,200
$1,400
In millions
Collar counties Suburban Cook County
Other Chicago districts Extended Chicago central business district

Local development
Page 43 of 48 tax incentives
The amount of incremental tax base available to fund TIF districts is highly dependent on
property value and development trends within each district. These regional trends are driven in
part by districts in Chicago’s central business district, which has seen significant commercial
investment in recent years. Despite phasing out a number of smaller districts, the city’s annual
TIF extensions increased 188.6 percent between 2002 and 2019. This accounts for around
three-quarters of regional growth. Total annual revenues also rose for TIF districts in suburban
Cook County (34.4 percent) and the collar counties (74 percent).
As of 2019, TIF tax increments on average account for around 5 percent of a community’s total
tax base. But this ratio rises to above 10 percent in 26 municipalities and more than 40 percent
in four: Elwood, Rosemont, Phoenix, and University Park. Elwood’s Deer Run Industrial Park TIF,
for example, includes the 6,400-acre CenterPoint Intermodal Center and has an incremental
EAV that is nearly twice as large as the municipality’s remaining tax base.
Although large TIF increments in relationship to a community’s total EAV suggest that effective
economic development efforts have generated new growth, there are risks to allocating
substantial tax base growth into TIF funds. For example, if a taxing authority needs to raise new
revenues from property taxes for non-TIF-eligible expenses, they may have difficulty doing so
without raising tax rates on all property owners in the district.
TIF transparency, Public Act 102-0127, and the need for better data
Municipalities must submit an annual report to the Illinois Comptroller for each TIF district,
including audited financial information and a description of all redevelopment activities.
58
These reports provide significantly more transparency around TIF districts than other types of
incentives, like sales tax rebates and Cook County incentive classification. But drawing
general conclusions about their use is still difficult, given the lack of detailed or machine-
readable data on TIF expenditures and the complex nature of market disinvestment.
Over the years, the State has amended TIF-enabling legislation to increase transparency.
Most recently, in July 2021, Public Act 102-0127 introduced new TIF reporting requirements
on projected and actual jobs and tax revenue resulting from any redevelopment agreement;
details about related debt service; and the “stated rate of return” identified by participating
developers.
59
Previous statute required certain elements of TIF reporting to be consistent
statewide; this act instructs the comptroller to make debt reporting consistent as well.
Mandating actual project results be reported alongside previously stated goals may enable
better analysis of incentive effectiveness and provide local leaders with new data to inform
future decisions. However, opportunities remain for improved transparency around TIF
districts that would facilitate more rigorous evaluation of their benefits and impact.
58
TIF annual financial reports can be found at https://illinoiscomptroller.gov/financial-data/local-government-division/local-
government-data/searchform/?SearchType=TIFSearch.
59
Public Act 102-0127 amends 65 ILCS 5/8-8-3.5, 5/11-74.4-5, and 5/11-74.6-22:
https://ilga.gov/legislation/BillStatus.asp?DocNum=571&GAID=16&DocTypeID=HB&LegID=128649&SessionID=110&GA=102

Local development
Page 44 of 48 tax incentives
Implementing ON TO 2050
ON TO 2050, northeastern Illinois’ comprehensive plan, calls for performance-based
approaches to economic development. Despite their potential drawbacks, incentives can be an
effective way to meet certain goals when they are well-targeted and used in line with best
practices. But sustained economic growth requires broader strategies for enhancing the public
assets and services that actually enable people and businesses to succeed. Implementation of
the plan’s recommendations will reduce the need for development incentives by making our
communities more competitive places to do business and improve incentive use to ensure that
they provide the greatest possible return on public expenditures where they are used.
The following reforms should be undertaken in partnership with local governments so that
communities are not negatively impacted. Strong and meaningful engagement of residents —
especially people of color with low income, and in places with eroded trust in public and
financial institutions — must be at the core of efforts around economic development and
investment. CMAP will continue to work with its partners on technical assistance, funding,
research, legislative, and other initiatives that offer comprehensive solutions to catalyze
growth.
Modernizing tax policies to sustain communities of all types
Under the current tax system, communities without retail development have few revenue
options to cover the cost of public services and infrastructure. Many are heavily dependent on
the property tax and retail sales to maintain general revenues, leading to the use of incentives
to pursue development. Illinois’ narrow sales tax base, which focuses on tangible goods and
few services, is increasingly out of sync with market demand for consumer services. State
statutory criteria for revenue disbursements, such as sales and motor fuel taxes, do not
effectively support municipalities with a very low tax base compared to the costs of providing
basic services. And in Cook County, property tax classification shifts a higher share of the
property tax burden to businesses and creates a barrier to attracting development in some
areas.
60
A reformed tax system could reduce the need for incentives and mitigate their market
distortions. The following actions would help to modernize Illinois’ overall tax system:
Expand the state’s sales tax base to additional consumer services.
Phase out Cook County’s property tax classification system.
Reform the state’s approach to disbursing state revenue to local governments to reduce
wide divergences across municipalities.
Invest in disinvested areas
Communities with a low tax base, high tax burdens, and limited options for increasing revenue
often face a self-reinforcing cycle of disinvestment. Shifts in residential and commercial
60
Chicago Metropolitan Agency for Planning, “Cook County Property Tax Classification Effects on Property Tax Burden,” Policy
Update, November 2014, https://www.cmap.illinois.gov/updates/all/-/asset_publisher/UIMfSLnFfMB6/content/cook-county-
property-tax-classification-effects-on-property-tax-burden.

Local development
Page 45 of 48 tax incentives
demand — as well as the legacy of racial discrimination and segregation — contribute to
challenges in older sub-regional jobs centers. Yet these communities have substantial and often
underused public assets, like existing freight and transit facilities, that could support
redevelopment. Instead, disinvested areas struggle with market feasibility due to weak
demand; a lack of anchor developments or agglomeration potential; negative reputation; low
public sector capacity; or a lack of developer confidence. The need to create jobs, improve the
local tax base, and fund municipal operations puts pressure on local officials to provide
incentives. Without structural change, local revenues in these areas are likely to continue
growing slower than the cost of public services, prolonging the disinvestment cycle.
Rebuilding disinvested areas — including upgrading existing transportation infrastructure,
addressing environmental challenges, and encouraging equitable private investment — is
critical to the region’s long-term prosperity. The region has made progress on targeting
resources to legacy communities, particularly Chicago’s South and West sides as well as Cook
County’s south suburbs. But more work is needed. Given the conditions common in many
disinvested areas, solutions must differ substantially from typical, market-based planning and
investment practices. Initial steps include:
Identify new regulations, programs, and incentives that benefit weak market areas.
Work with regional land banks to promote strategic investment in disinvested areas.
Identify and implement policies and regulatory strategies to preserve affordability,
quality of life, and community character.
Develop creative approaches to removing the financial barriers that prevent disinvested
areas from accessing some transportation funding programs.
Explore opportunities to create programs that close funding gaps and provide planning
assistance for capital needs in disinvested areas.
Identify and pursue public investments — including new transportation programs and
infrastructure — that can catalyze reinvestment and equitable growth in disinvested
areas.
Bring banks and lending institutions together with municipalities to ensure that weak
market communities have access to capital and financial services.
Target technical assistance, trainings, and other assistance to municipalities in low-
income or low-market areas.
Reform incentives for economic development
ON TO 2050 recommends reforming development incentives within a larger program of
sustainable regional economic development. Local officials are looking for tools and strategies
that make a significant impact on their communities, and often make extensive use of financial
incentives to attract and retain businesses. Targeted incentive use can be necessary for certain
developments that support local and regional goals, but using performance-based approaches
can help make the best use of public dollars.

Local development
Page 46 of 48 tax incentives
Local practices can help to maximize the benefits and minimize the costs and risks of incentive
use. The state, counties, and multijurisdictional groups can encourage the adoption of best
practices at the local level. Improving local development incentives, CMAP’s guide for local
practitioners, reviews best practices on how, where, and when to apply incentives more
effectively. It focuses on four principles — equity, transparency, pursuit of regional benefits,
and performance-driven use — and includes practices such as:
Implement an incentive policy or framework in coordination with neighboring and
overlapping taxing districts.
Use business conditions, clawbacks, and other best practices to ensure that
development incentives fit with local and regional goals, including the creation of high-
quality jobs and provision of neighborhood amenities.
Minimize the use of incentives that are only for fiscal gain, focusing instead on
maximizing broad benefits.
Understand a development’s short- and long-term impact on public services and
infrastructure, and evaluate the ability of the district to sustainably fund new costs,
before committing to incentives.
Institute stronger standards for transparency and accountability
Incentive programs should be regularly evaluated to ensure performance against goals. This
requires thorough data about the goals, incentive agreements, and fiscal and economic
outcomes. Public agencies already publish a significant amount of information on some
incentives,
61
and previous reforms have provided greater transparency on new agreements.
62
But the resulting data are often inadequate to determine the value and effectiveness of these
investments. Disclosure standards differ based on the type of incentive, and key information is
often missing, redacted, or inconsistent.
Proper evaluation should be able to account for an incentive’s full costs and benefits, its
progress in achieving its public purpose, and trade-offs relative to other government activities.
The State of Illinois should take a leadership role in instituting stronger standards for
transparency and accountability. But individual communities can practice transparency without
waiting for new state requirements. Both state and local governments should take the
following steps:
Require a regular audit of all development incentives.
Maintain sunset provisions on all incentive agreements and programs, allowing periodic
reevaluation.
61
See, for example, reporting requirements under 55 ILCS 5/5-1014.3 and 65 ILCS 5/8-11-21 for sales tax rebate agreements as
well as under 65 ILCS 5/11-74.4-5 for tax increment financing.
62
National governmental accounting standards require state and local governments to disclose in their financial reports details
about incentives that affect their ability to raise revenue. See Governmental Accounting Standards Board, Statement No.77, Tax
Abatement Disclosures, August 2015, https://gasb.org/jsp/GASB/Pronouncement_C/GASBSummaryPage&cid=1176166392168.

Local development
Page 47 of 48 tax incentives
Make comprehensive data on development incentives available, including consistent
details on spending that clearly describe the purpose and recipients; the economic and
fiscal impacts of incentive programs; and the quality of jobs created.
Ensure that accurate, non-proprietary data can be reliably obtained and analyzed.
Specific improvements should be developed in collaboration with stakeholders to identify
achievable changes that increase transparency and provide the opportunity to evaluate
programs. Potential options include:
Give research partners access to additional details about sales tax rebate agreements
(including agreement text and amounts rebated) through data use agreements that
protect proprietary business data.
Evaluate the impacts of property classification in Cook County, as well as the use of
commercial and industrial incentive classes, to inform discussions on potential reforms.
Identify opportunities to increase the consistency and detail of TIF district expenditure
reporting and provide access to additional data, such as development agreements.

Local development
Page 48 of 48 tax incentives
Moving forward
In the current economic and fiscal landscape, local governments’ use of incentives to pursue
development often makes sense. The motivations behind incentive use vary widely, including
recruiting grocery stores into food deserts, reactivating long-vacant land, and competing with
neighboring governments for new tax revenues. Faced with competition and limited resources
to produce results, local officials often see incentives as go-to tools for pursuing these goals.
The impacts of incentive use are varied as well. Some incentives enable developments that lead
to new job centers or revitalized neighborhoods. Others, however, are unnecessary subsidies to
businesses that would have located in the area regardless or that fill space another user would
have occupied. Understanding these dynamics is difficult without knowing what would have
happened if a different incentive — or no incentive at all — had been authorized.
At the same time, the general use of local incentives poses long-term regional challenges.
Competition between local governments can provide benefits, but negotiating on tax rates can
reduce net revenues collected by the region’s taxing districts and inequitably shift tax burdens
among taxpayers. Historically disinvested communities often have fewer resources while facing
particularly large needs, so they experience the largest fiscal consequences of significant
incentive use. And competition between communities for specific businesses can distract from
other, cooperative efforts to enhance regional assets and promote sustainable growth.
This report shows that incentives impact the revenue-generating capacity of one-quarter (26
percent) of the region’s commercial and industrial property and that incentive use has
increased in recent years. Incentives are also concentrated in poorer communities with more
residents of color, historic industrial areas, and Cook County where classification raises effective
tax rates for many commercial and industrial users. These patterns reflect the difficulty local
governments face achieving local development amid slow regional growth.
CMAP encourages local governments to pursue the best practices for incentive use provided in
Improving local development incentives. This guide details over 50 actions that practitioners
can take to target, monitor, evaluate, and improve their use of these tools.
At the same time, it is important that policymakers pursue programs, policies, and reforms that
support all communities, improve regional cooperation, and enhance northeastern Illinois’
overall economic position. This includes efforts to bolster and equitably distribute state
resources for local governments; implement modern tax policies that are consistent across
jurisdictions; invest in disinvested areas; and institute strong statewide reporting requirements
to promote regular evaluation and improvement of incentives. Implementing these strategies
will reduce the need for local incentives, make northeastern Illinois a leader in effective
incentive use, and advance inclusive economic growth.

The Chicago Metropolitan Agency for Planning (CMAP) is the
region’s comprehensive planning organization. The agency and
its partners developed and are now implementing ON TO 2050, a
long-range plan to help the seven counties and 284 communities
of northeastern Illinois implement strategies that address
transportation, housing, economic development, open space,
the environment, and other quality-of-life issues.
cmap.illinois.gov
312-454-0400
info@cmap.illinois.gov
FY22-0028
