

Agenda
2:30 PM
Introduction Bruce Flatt
2:40 PM
Overview and Financial Outlook Nick Goodman
3:10 PM
Real Estate Update Brian Kingston
3:30 PM
Insurance Solutions Sachin Shah
3:50 PM
Q&A Bruce Flatt
Nick Goodman
Brian Kingston
Sachin Shah

Introduction
Bruce Flatt, Chief Executive Officer
Information in this presentation is qualified by the Notice to Recipients and Endnotes included in this presentation

To summarize
• Brookfield Corporation is a Premier Global Wealth Manager for institutions and individuals
• We manage capital for our investors, global sovereigns, institutions and private individuals
through our asset management, wealth distribution, and insurance channels
• We are uniquely positioned to invest for our clients in the backbone of the global economy
• Our moat is widening as we further scale and diversify the business
• The permanent capital base of $140 billion backs one of the largest pools of discretionary
capital globally. This enables us to differentiate our capital
• Our $74 of Net Asset Value per share should compound at 17% to $163 by 2028 – allowing
investors a large margin of safety
1. See Notice to Recipients and Endnotes, including endnotes 1 to 3.
4

In the last 12 months, we…
Successfully listed our Manager
Grew our insurance assets to $100 billion
Raised nearly $75 billion of capital
Delivered strong operating results
Enhanced our deployable capital to nearly $120 billion
1. See Notice to Recipients and Endnotes, including endnote 4.
5

$74
Plan Value per Share Cash Distributions for our Manager Spin-Off
2022
2023
We achieved a 13% total return since last year
$74
$83
13%
Total
Return
6
You received $9 in distributions and still have $74 of Value working for you!!
2023
2028
$74
$163
Over the next five years, we should be able to deliver a
total annualized return on invested capital of 17%
Plan Value per Share
1. See Notice to Recipients and Endnotes, including endnotes 1 to 3.
17%
Total
Return
7
Your $74 per share should grow to $163 of Net Asset Value

We continue to position Brookfield
as the Premier Global Wealth Manager
– for institutions and individuals
8

Our goal is to compound wealth, while taking moderate risk, for…
Institutions Pension Plans Countries Individuals
& Families
9

Scale
Perpetual
Capital
Flexible
Insurance
Float
Diversified
Global
Manager
$140B
Capital
$100B
Float
$850B
AUM
We have one of the largest pools of
discretionary capital globally
1. See Notice to Recipients and Endnotes, including endnotes 2 to 4.
10

Global Secular
Trends
The current environment favors Brookfield
Investment
Backdrop
Scarcity of
Capital
Three D’s Our access to
capital is strong
Our deep operating
expertise differentiates us
11

Global footprint
Large & flexible
permanent capital base
Deep investment &
operating expertise
Established reputation
as a superior partner
Now more than ever, our significant competitive advantages
are differentiating the franchise
12
Enabling us to execute on major transactions even in a volatile market
13

On their own,
each of our businesses has a
strong foundation for growth…
14

But when the different parts
work together, what we can achieve
is significantly larger…
15

And allocating cash flows and
recycling capital should
significantly enhance returns
16

With the Corporation at the heart of everything we do…
Asset
Management
Insurance
Solutions
Operating
Businesses
BN
17

~$140B perpetual
capital base
Strategic
growth
Stable and growing
annual cash flow of $5B
Capital Appreciation Cash Reinvestment
& Recycling
Building Our Next
Global Champion
An investment in BN captures ALL of the value Brookfield creates
18

Following the successful listing of our
Manager, the spotlight has shifted to
our privately held businesses
19

The components of the business that are not
otherwise already separately covered are our…
Insurance Business, which has $100 billion of assets and growing
Our portfolio of high-quality real estate, which is world class
Carried Interest, which generates significant cash flow for us and
is our hidden jewel that lies in plain sight
1. See Notice to Recipients and Endnotes, including endnote 4.
20

We have never been better positioned
to enhance value…
Our goal continues to be delivering
15%+ returns over the longer term
21

Our Asset Management business…
• Is more diverse and growing faster than ever
• Has an investment track record that has delivered excellent returns
to clients over a long period of time
• Is well positioned around global secular tailwinds of capital deployment
• Has resilient cash flows, with best-in-class, long-term annuity-like revenues
22

to
$440B >$1T
Fee-Bearing Capital
Our goal is to surpass $1 trillion
of fee-bearing capital
1. See Notice to Recipients and Endnotes, including endnote 5.

Our Insurance Solutions business is growing rapidly
• Our goal is to deliver strong growth but take moderate risk – we limit insurance risk
and enhance returns with investment performance
• Our deep industry relationships and investment expertise position this business
as the partner of choice for regulated insurance companies
• Synergies with the broader investment platform and access to capital
should enable substantial growth while still achieving 20%+ equity returns
• The flexibility of our capital and our strong reputation should accelerate growth
now that we are at scale
1. Brookfield estimate. See Notice to Recipients and Endnotes.
24

$500B
Insurance Assets
We plan on reaching $500 billion
of insurance assets
to
$100B
1. Brookfield estimate. See Notice to Recipients and Endnotes, including endnote 4.

Our Operating Businesses are best-in-class
• We deploy our capital across our global champions that generate inflation-
protected, stable, predictable and growing annual free cash flows
• Our strategies allow us to compound capital at 15%+ on a baseline basis
• We have a proven track record of strong-risk adjusted returns and have
delivered resilient cash flows across market cycles
• Each business is self-funding with deep access to public and private pools
of capital
26

But, as in most businesses, Cash Reinvestment
is the secret to long-term returns
• Over the next five years, we plan to generate
~$45 billion of cash
• We have no restrictions on where to deploy this cash
• We focus on allocating our free cash flows to optimize
the business over the longer term and recycling capital
to sustain long-term growth and returns
• We also have $60 billion of listed securities that can be
turned to cash if required
~$45B
1. See Notice to Recipients and Endnotes, including endnote 6.
27

Our capital will be opportunistically allocated toward the following…
Investing to support our current businesses
Selectively building new businesses
Being ready for strategic transactions
Opportunistically doing share buybacks of BN, or our other securities
28

Global Wealth of individuals is our next frontier to add capital
• This is one of the fastest growing pools of capital globally
• We are pushing growth in wealth distribution – Brookfield Oaktree
Wealth Solutions
• We are now delivering solutions to the middle market with insurance products
• Soon we will launch our High-Net-Worth global channel to manage wealth for
individuals who are seeking increased exposure to our type of assets
29
Our goal is to be the Premier Global Wealth Manager

Reinvestment of
Cash Generated
Our Existing
Businesses
Bringing it all together, the Corporation’s value is driven by
30

We are well positioned to compound
our capital by ~20% per year
over the next five years…
31
1. See Notice to Recipients and Endnotes, including endnotes 1 to 3.

And grow our moat significantly
32
1. See Notice to Recipients and Endnotes, including endnotes 1 to 3.
Value Per
Share
$74 $163

Overview and Financial Outlook
Nick Goodman, President
Information in this presentation is qualified by the Notice to Recipients and Endnotes included in this presentation

Agenda
Agenda
01
Summary
02
Review of the Past
03
Our Business
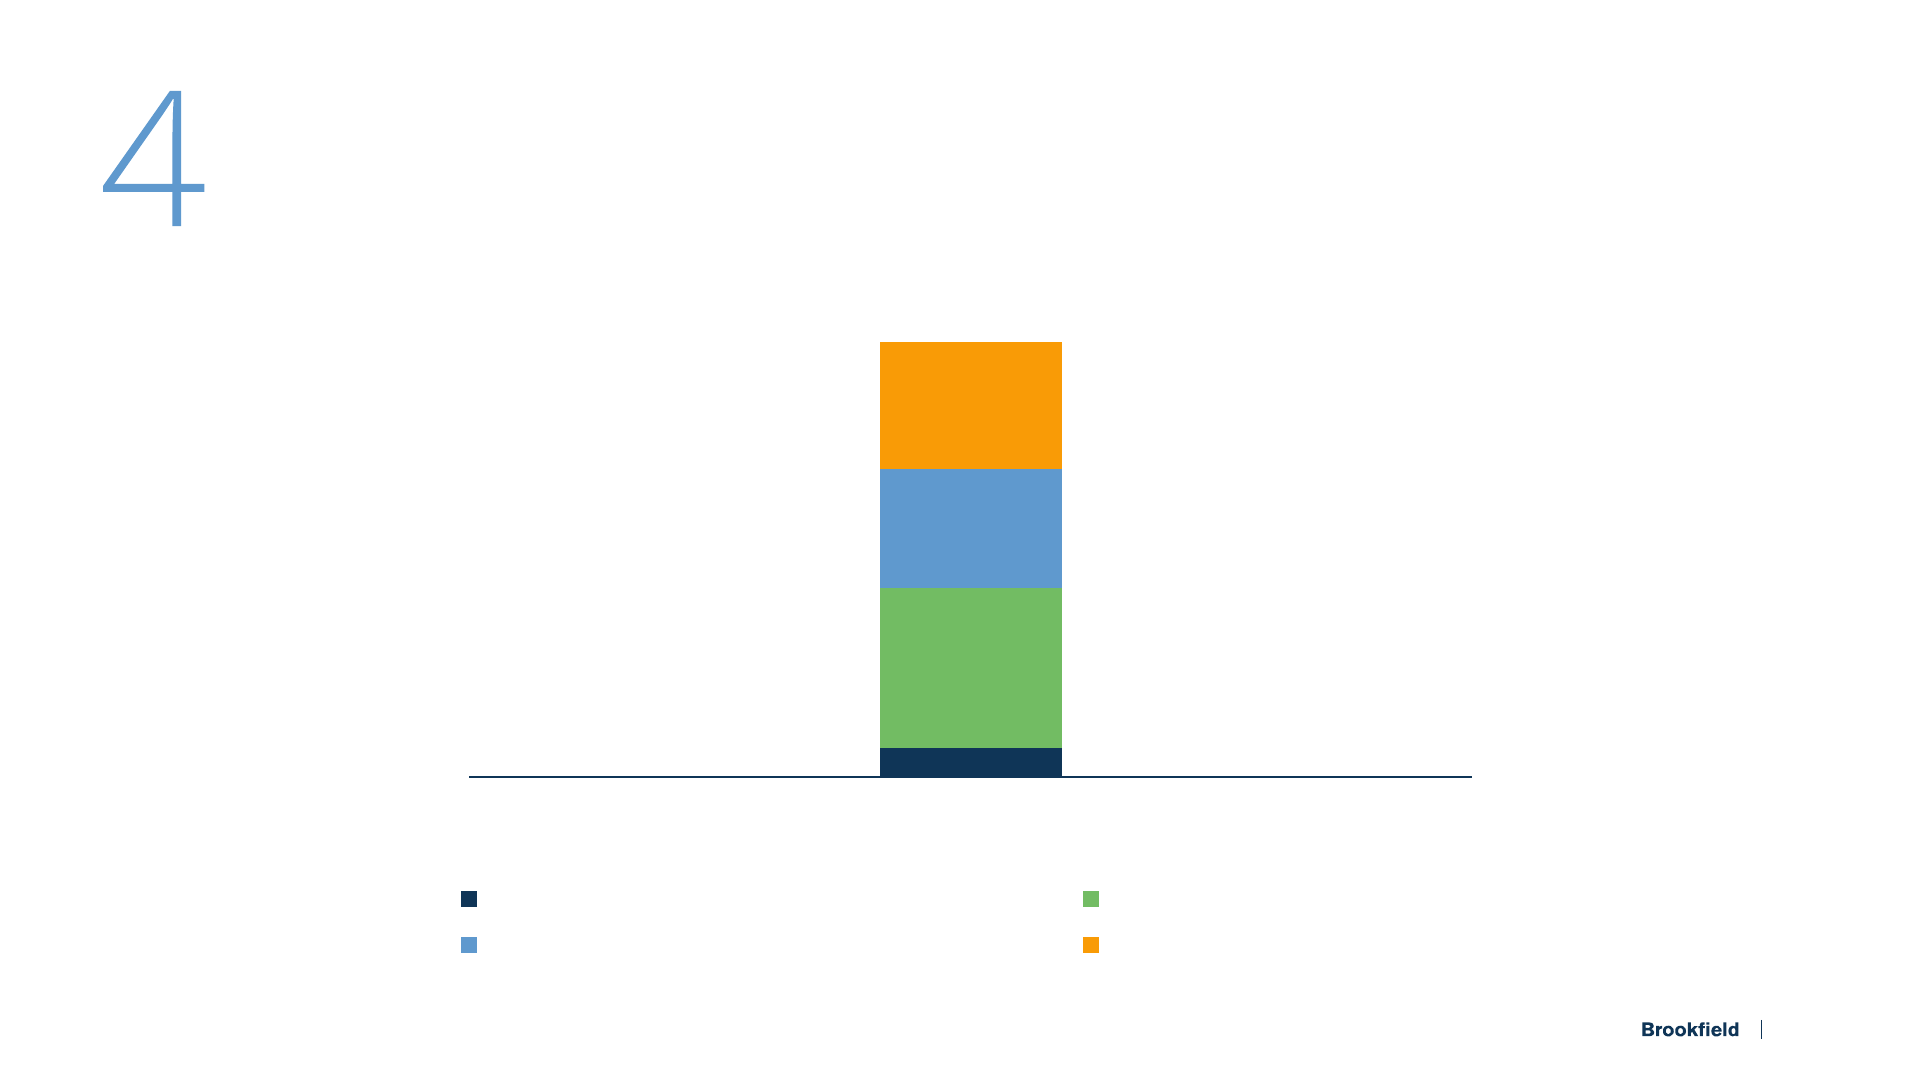
04
Looking Forward
05
Bringing It All Together

Summary

In summary
• Our capital base has grown to ~$140 billion with $120 billion of equity
• We generate $5 billion of cash flow per year
• We are well positioned to grow earnings at 20%+ annually over the next five years
• Our goal is still to generate 15%+ total returns over the long term
1. See Notice to Recipients and Endnotes, including endnotes 1 to 3, 5.
36

In summary (cont’d)
• Our private businesses will be significant contributors to our growth
• Our goal is to be the Premier Global Wealth Manager of choice
• The current trading price offers a large margin of safety for an investor
• Our ESG principles are embedded within our operations
37

Review of the Past

For the 12 months ended June 30
($ millions)
2022 2023
Asset Management
$
2,419 $ 2,483
Insurance Solutions 85 634
Operating Businesses 1,528 1,512
$
4,032 $ 4,629
Corporate costs and other (651) (551)
Distributable earnings before realizations
$
3,381 $ 4,078
Per share
$
2.09 $ 2.56
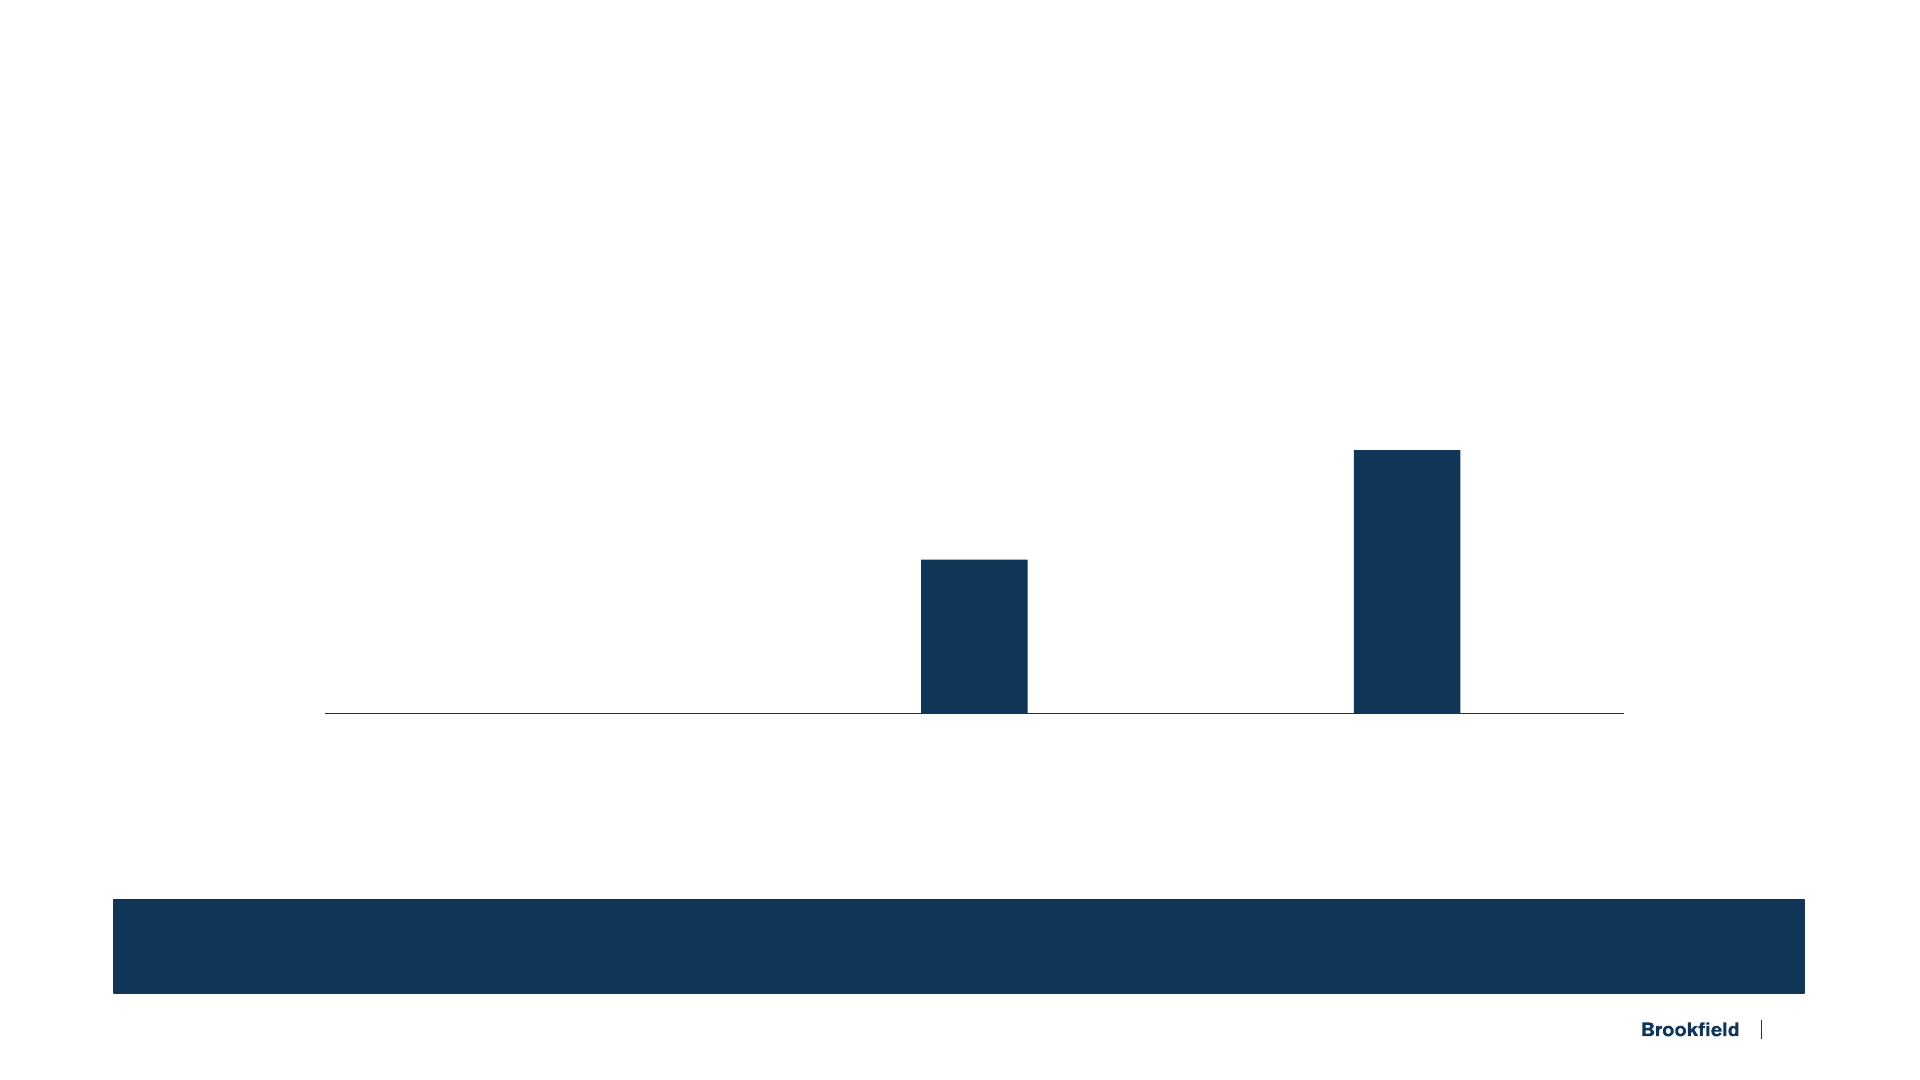
We delivered strong growth over the past year…
21%
22%
39
1. See Notice to Recipients and Endnotes, including endnote 16.

For the 12 months ended June 30
($ millions)
2022 2023
Distributable earnings before realizations
$
3,381 $ 4,078
Realized carried interest, net 463 755
Disposition gains from principal investments 567 134
Distributable earnings
$
4,411 $ 4,967
Per share
$
2.73 $ 3.13
…and continue to generate predictable, growing distributable earnings
13%
15%
40
1. See Notice to Recipients and Endnotes, including endnote 16.

Over the last twelve months, we have returned ~$15 billion
of capital to our shareholders
($ billions)
2023
Regular Dividends
$ 0.7
Special Dividend
13.1
Opportunistic Share Repurchases
1
0.7
Capital Returned
$ 14.5
41
1. Opportunistic share repurchases include $0.2 billion completed post June 30, 2023.

Underpinned by our conservative balance sheet, high levels of liquidity
and strong access to capital across the business
$11B long-term debt
~$5B perpetual preferred equity
~$120B perpetual common equity
Conservative Capitalization Strong Corporate Liquidity
~$140B
$5B
Cash,
financial assets and
undrawn facilities
~$60B
Listed securities
42
1. Figures as at June 30
th
.

$2.5B
$2.6B
$3.8B
$4.3B
$5.1B
2019 2020 2021 2022 2023
Actuals
We are ahead of our baseline plans from five years ago
~$17.8B
Five-Year Cumulative Projection
~$18.3B
Five-Year Cumulative Actuals
15%
CAGR
1. Figures as at June 30
th
.
43

Assess climate impact
from underwriting
through exit
Operate one of the world’s
largest pure-play renewable
power platforms
Align with
industry-leading
ESG frameworks
Remain committed
to a diverse and
inclusive workplace
NZAM
Net Zero
Asset Managers
Diversity in
Action Initiative
Our existing businesses demonstrate that sound ESG practices
are key to creating long-term value
44

Published our inaugural TCFD disclosure
Raised $15B for our Brookfield Global Transition strategy
75% of independent board of directors are female
40% of our employee population is ethnically diverse
100% of Brookfield Properties U.S. office portfolio
committed to be powered by clean energy by 2026
…as evidenced by our continued progress
Net Zero
by 2050 or sooner
45

As at June 30
($ billions, unless otherwise stated)
2023
Asset Management
$
85
Insurance Solutions 8
Operating Businesses 45
$
138
Debt and preferred capital (18)
Total plan value
$
120
Total plan value per share
$
74
Our plan value today is $120 billion or $74 per share…
24x
DE Multiple
(Today)
15x
Average DE
Multiple
(Next Five Years)
1. See Notice to Recipients and Endnotes, including endnotes 2, 3, 5 and 7.
46

$74
2022 2023
Plan Value per Share Cash and Special Distributions
…resulting in a 13% total return since last year
13%
Total
Return
$74
$83
You received $9 of distributions and still have the same value as before!
1. Multiple of 25x on fee-related earnings in 2022. See Notice to Recipients and Endnotes, including endnotes 2 and 3.
47

Carried
Interest
We grew our intrinsic value in line with our plan five years ago
Plan Value per Share
$74
Asset
Management
Insurance
Solutions
Operating
Businesses
14%
CAGR
2018 2023
$39
1. 2018 was adjusted for the impact of the 3-for-2 stock split on April 1, 2020. Multiple of 20x was applied to fee-related earnings in 2018.
2. See Notice to Recipients and Endnotes, including endnotes 2 and 3.
48

2018–2023
Growth in plan value
14%
Average dividend yield and benefit of spin
-offs 4%
Total Compound Annual Return
18%
Achieving a total return in excess of our target
1. See Notice to Recipients and Endnotes, including endnotes 2 and 3.
49

800
2800
4800
6800
8800
10800
12800
1.5
11.5
21.5
31.5
41.5
51.5
61.5
BN BN NAV S&P 500
Our shares have still delivered 19% returns over the past 20 years –
merely having the Price trade at Value brings that return to 23%
2003
2023
$34
10%
Annualized
Return
19%
Annualized
Return
1
$74
1. Represents total compounded return, with dividends reinvested.
2. See Notice to Recipients and Endnotes, including endnotes 2 and 3.
50

As at June 30
($ per share, unless otherwise stated)
Intrinsic Value
Total Plan Value $ 74
Equity Market Capitalization (34)
Discount to Plan Value 55%
Our Price versus Value discrepancy offers a large margin of safety;
or substantial upside from today
11x
Trading
DE Multiple
(Today)
7x
Average Trading
DE Multiple
(Next Five Years)
1. See Notice to Recipients and Endnotes, including endnotes 2, 3 and 5.
51

Our Business

Asset Management
(BAM)
Insurance Solutions
(BNRE)
Operating Businesses
(BEP/BIP/BBU/BPG)
$85B $8B $45B
Leading global alternative
asset management business
Global insurance
solutions business
Portfolio of global, scale
operating champions
Our perpetual capital base of ~$140B is generating
over $5B of cash flows annually
1. See Notice to Recipients and Endnotes, including endnotes 2, 3 and 7.
53

As at June 30, 2023
(Billions) (Per Share)
Public Holdings
$ 60
Private Holdings
78
Debt and preferred capital
(18)
Intrinsic Value
$ 120 $ 74
The intrinsic value of our existing businesses is
$120 billion or $74 per share…
54
A
B
B
1. See Notice to Recipients and Endnotes, including endnotes 2 and 3.

As at June 30, 2023
(Billions) (Per Share)
BAM − 75% $ 40
BEP − 47% 9
BIP − 27% 8
BBU − 65% 3
Public Holdings $ 60 $ 37
A. Our public holdings are straightforward and transparent
55
These are all listed!

As at June 30, 2023
(Billions) (Per Share) Valuation Method
Asset Management
Direct Investments
$
14 Fair value under IFRS
Carried Interest 32 Multiple of target carry
Real Estate
Core 14 Fair value under IFRS
Transitional & Development 10 Fair value under IFRS
Insurance Solutions 8 Multiple of spread earnings
Private Holdings
$
78 $ 48
B. We value our private holdings at $78 billion or $48 per share
1. See Notice to Recipients and Endnotes, including endnotes 2, 3 and 7.
56

Asset
Management
A) Direct investments Generating excellent returns
B) Carried interest Will generate significant cash
earnings
Real Estate Premium portfolio Strong Net Operating Income
performance
Insurance Premium returns
and growth
20% Return on Equity
Our focus for you today is to explain our private businesses
57

1A. Asset Management –
Direct Investments
58

Directly on our balance sheet we have
$14 billion of direct investments
in funds managed by BAM
59
1. Figures as at June 30
th
.
…targeting strong long-term returns
60
1. Current Investment is as at June 30, 2023. See Notice to Recipients and Endnotes, including endnotes 8 and 9.
Target Return
($ billions)
Original
Investment
Capital Returned
To Date
Current
Investment Gross Net
BSREP I
$ 1.6 $ 2.8 $ 0.3 ~20% ~16%
BSREP II
2.7 2.7 2.2 ~20% ~16%
BSREP III
3.6 0.9 4.2 ~20% ~16%
BSREP IV
1.8 0.1 1.7 ~20% ~16%
Oaktree Investments
2.1 ‒ 2.1 ~15% ~10%
Private Equity Investments
1.7 0.7 1.1 ~20% ~15%
Other Funds and Co-Investments n/a n/a 2.1 ~15% ~11%
Total $ 13.7

1B. Asset Management –
Carried Interest
61

Carried interest is our share of the
profits we earn for our clients
62

By way of an example…
Fund size $ 20B
Target return 20%
Management fee rate (1.5%)
Net return 18.5%
Carried interest rate 20%
Margin 70%
Annual carried interest, net $ 520M per year
63

A
Carry-Eligible
Capital
Investment
Performance
Carried Interest
Rate & Margin
Key inputs of carried interest
B
C
64
A
$47B
$72B
$122B
$144B
$176B
$220B
2018 2019 2020 2021 2022 2023
36%
CAGR
Our carry-eligible capital has grown by a 36% CAGR over five years
65
1. Figures as at June 30
th
.

Our funds are tracking to meet or exceed their target returns
B
66
1. Reflects performance of flagship funds and similar strategies. See Notice to Recipients and Endnotes, including endnotes 9 to 11.
2. Target Real Estate gross and net returns include only the Brookfield Strategic Real Estate Funds target returns. Target Private Equity gross and net returns include BCP II to VI.
Target Return IRR
As at June 30, 2023
Fund
Fund
History
Number of
Vintages Gross Net Gross Net
Infrastructure/Renewable Power 13 years 5 13% 11% 16% 13%
Private Equity 22 years 6 21% 18% 28% 22%
Real Estate 17 years 7 20% 16% 23% 19%
Credit 35 years 12 15% 10% 22% 16%
Transition 2 years 1 13% 10% n.m. n.m.

Our carried interest rate and margin are consistent
60%
Margin
20%
Carried Interest Rate
C
67
1. Carried interest rate and margin are based on Brookfield’s flagship funds.

$1B
$3B
2023 2028
Net
$0.8B
$3B
2023 2028
Net
Annual Generated Carry
Realized Carry
$2B
$7B
$6B
$1B
…our carry potential is expected to continuously grow
over the next five years
2023 2028
19%
CAGR
Carry-Eligible Capital
$527B
$220B
68
1. As at and for the last twelve months ended June 30, 2023. Carried interest figures are presented gross of costs. See Notice to Recipients and Endnotes, including endnotes 5 and 12.
29%
CAGR
36%
CAGR

Monetization activity has ramped up significantly over the last five years
~$30B
2023
~$10B
2018
69
1. Figures as at June 30
th
.

$0.5B
$0.5B
$1.5B
$1.1B
$1.2B
2019 2020 2021 2022 2023
2019 2020 2021 2022 2023
2018 IR Day Projections Actual
~$4.8B
Five-Year Cumulative Actuals
~$3.1B
Five-Year Cumulative Projection
With that, we significantly exceeded our five-year plans for realized carry
70
1. Figures as at June 30
th
.

Looking forward, our carried interest is diversified across asset classes,
risk profiles and strategies – this reduces volatility
36%
23%
17%
14%
10%
Real Estate Infrastructure Private Equity Renewable Power & Transition Credit and Other
71
1. See Notice to Recipients and Endnotes, including endnote 8.

1.3
2.2
2.5
2.8
2.8
2.6
2.1
1.7
1.0
1.2
0.8
0.9
1.4
2.4
$1.3B
$2.2B
$2.5B
$2.8B $2.8B
$2.9B $2.9B
$2.6B
$2.4B
$3.6B
2024 2025 2026 2027 2028 2029 2030 2031 2032 2033
Realized Carried Interest on Funds Raised to Date Realized Carried Interest on Funds to Be Raised
$6 billion
On Funds to Be Raised
$20 billion
On Funds Raised to Date
1.0
72
1. Figures as at June 30
th
. See Notice to Recipients and Endnotes, including endnote 8.
Driving growth in net realized carried interest to BN

We value carry as a multiple of target carried interest
plus accumulated unrealized carry
Target Carried
Interest
An Industry Multiple
(10x currently)
Accumulated Unrealized
Carried Interest
Carry we expect to earn
assuming the fund achieves
the target return, annualized
on a straight-line basis
Accumulated carry generated
based on fund performance
to date, assuming funds are
liquidated at current values
Reflecting franchise value
X
73

Our carried interests are our hidden jewel in plain sight…
but NONE
of this is recorded in our accounts
As at June 30, 2023
($ billions)
Multiple Intrinsic Value
Target carried interest, net $ 2.6 10x $ 26
Accumulated unrealized carried interest, net 5.9 6
Total carried interest $ 32
74
1. See Notice to Recipients and Endnotes, including endnotes 2 and 3.
We value our carried interest at $32 billion

($ billions)
NPV of carried interest to be realized from existing funds $ 14
NPV of carried interest to be realized from future funds (Franchise Value) 18
Total carried interest $ 32
~50% of value is derived from existing private funds
75
1. See Notice to Recipients and Endnotes, including endnotes 2 and 3.

• Carry is very meaningful, real, and not a matter of if, but when it turns to cash
• We value our carry at $32 billion today
• Carry should provide $26 billion of cash flow over the next 10 years alone
Key Takeaways on Carry
76
1. See Notice to Recipients and Endnotes, including endnotes 2, 3 and 8.
Carry is our hidden jewel in plain sight

Also, our plan value does NOT ascribe
any value to the Corporation’s ability to
drive earnings growth from the
reinvestment of excess cash flow, but…
77
$0B
$0.7B
$1.2B
2020 30-Jun-23 2023
For example, in just over three years, we have built an
insurance business that generates ~20% cash returns on equity
Distributable Earnings
2020 Pro-forma
Committed Growth
1
…and provides significant strategic value to the broader franchise
June 30,
2023
78
1. See Notice to Recipients and Endnotes, including endnote 14.

Looking Forward

To summarize
• Our global champions provide stable and growing cash flows for the business
• Growth in DE over the next five years is driven by:
• Carried interest will provide us with meaningful earnings, above and beyond our
recurring free cash flows
• Plan Value is expected to be $163 per share in five years, generating a total return
of 17% from the Value of $74 today
• Your entry point today can lead to even better returns, as you can acquire shares
at a cheaper Price versus the compounding Value
80
1. See Notice to Recipients and Endnotes, including endnotes 1 to 3 and 5.
1) Asset Management 2) Insurance Solutions 3) Cash Reinvestment at BN

Our franchise is stronger, and its
value proposition is better than ever
81

To summarize, in five years, we plan to
Grow Distributable Earnings per share by
Increase Plan Value per share by
Deliver annual Total Returns per share of
25%
CAGR
17%
CAGR
17%
82
1. See Notice to Recipients and Endnotes, including endnotes 1 to 3 and 5.

Our Asset Management business should deliver 18% growth without
multiple expansion
As at June 30
($ billions, except percentages)
2023 2028
BAM
Fee-related earnings
1
$ 2.2 $ 4.8
Fee-bearing capital 440 1,014
Margin 55−60% 60%+
Distributable earnings
1
2.2 5.0
17%
CAGR
18%
CAGR
18%
CAGR
83
1. Represents LTM figures as at June 30, 2023.
2. See Notice to Recipients and Endnotes, including endnote 5.

Our Insurance Solutions business is scaling rapidly
84
1. 2023 assets exclude the impact of the recently announced acquisitions. See Notice to Recipients and Endnotes, including endnote 5.
As at June 30
($ billions, except percentages)
2023 2028
Assets $ 45 $ 250
Spread earnings ~2% ~2%
Distributable operating earnings $ 0.7 $ 3.9
41%
CAGR
40%
CAGR

Strong track record of
risk-adjusted returns
15%
IRR Over ~35 Years
Compounding value
appreciation
~$5B
Target Annual
Capital Appreciation
Resilient and growing
cash distributions
~$1.5B
Annual DE
Our Operating Businesses continue to grow their cash flows and
compound in value
85
Operating Businesses Asset Management
Insurance Solutions Realized Carried Interest
2024–2028
$43B
Over the next five years, our free cash flow should be ~$45 billion
86
1. See Notice to Recipients and Endnotes, including endnotes 5 and 15.

($ billions)
2024–2028
Distributable earnings
$ 43
Less: regular dividends paid to shareholders
(3)
Excess cash flow
$ 40
…leading to significant excess cash flow to invest into new opportunities
87
1. See Notice to Recipients and Endnotes, including endnotes 5, 6 and 15.
Absent investment opportunities,
capital will be available to return to shareholders

Reinvestment of excess cash should add ~$3 billion of cash flows
over the next five years
Distributable Earnings Before Realizations
Operating Businesses Asset Management
Insurance Solutions Cash Reinvestment
$3.8B
$10.3B
22%
CAGR
2023 2028
88
1. See Notice to Recipients and Endnotes, including endnote 5.

Carried interest will generate meaningful cash flow and
as a result, DE should be ~$14 billion in 2028
Distributable Earnings
Operating Businesses Asset Management Insurance Solutions
Cash Reinvestment Realized Carried Interest
$4.5B
$13.6B
25%
CAGR
2023 2028
89
1. See Notice to Recipients and Endnotes, including endnote 5.

25%
CAGR
Growth in DE for BN is driven by
21%
Cash Reinvestment
35%
Insurance Solutions
2%
Operating Businesses
42%
Asset Management
90
1. See Notice to Recipients and Endnotes, including endnote 5.

• We have many levers to access liquidity from the
markets
• Our businesses are predominantly financed with asset-
level debt that has recourse only to the asset and has
no cross-collateralization
• We align financing with the long-term hold periods of
our businesses to withstand market cycles
8%
Debt to
Plan Value Ratio
Our balance sheet and funding model will remain
conservatively capitalized going forward
91
1. Figures as at June 30
th
.

Bringing It All Together

$2.86
$8.41
Operating Businesses Asset Management Insurance Solutions
Cash Reinvestment Realized Carried Interest
DE
$2.38
$6.34
2023 2028
DE Before Realizations
2023 2028
$ per share
If we achieve this plan, DE before realizations and DE per share should
increase at a 22% and 25% CAGR, respectively, over the next five years
22%
CAGR
25%
CAGR
93
1. See Notice to Recipients and Endnotes, including endnote 5.

$34
$74
$163
25
28
26
$10
2023
Market Price
2028
Plan Value
17%
Total
Return
2023
Plan Value
Plan Value per share should increase to $163 by 2028
Asset
Management
Insurance
Solutions
Cash
Reinvestment
Carried
Interest
94
1. See Notice to Recipients and Endnotes, including endnotes 1 to 3.
For example, given the entry point, if we liquidated the company in 2028,
then we could provide you a 37% return (prior to tax)!!
37%
Total
Return

In conclusion
• Our franchise is stronger, and our investment proposition is better than ever
• BN captures all the earnings generated across the franchise and drives additional
growth through proven cash reinvestment
• We are well positioned to grow earnings at 20%+ per annum over the next five years
• This is all underpinned by a very conservative balance sheet and strong liquidity
• We are set up to deliver 15%+ per share total returns over the long term
95
1. See Notice to Recipients and Endnotes, including endnote 5.

Real Estate Update
Brian Kingston, Chief Executive Officer

In summary
97
• Our real estate business is performing extremely well
• Our core portfolio continues to outperform the overall market
• We continue to execute value creation in our transitional & development portfolio
• A resilient economy drives demand for land and housing
• We completed all 2023 refinancings with minimal liquidity impacts and anticipate
the same moving forward
• And expect to continue delivering strong cash flow and compounding of capital for BN
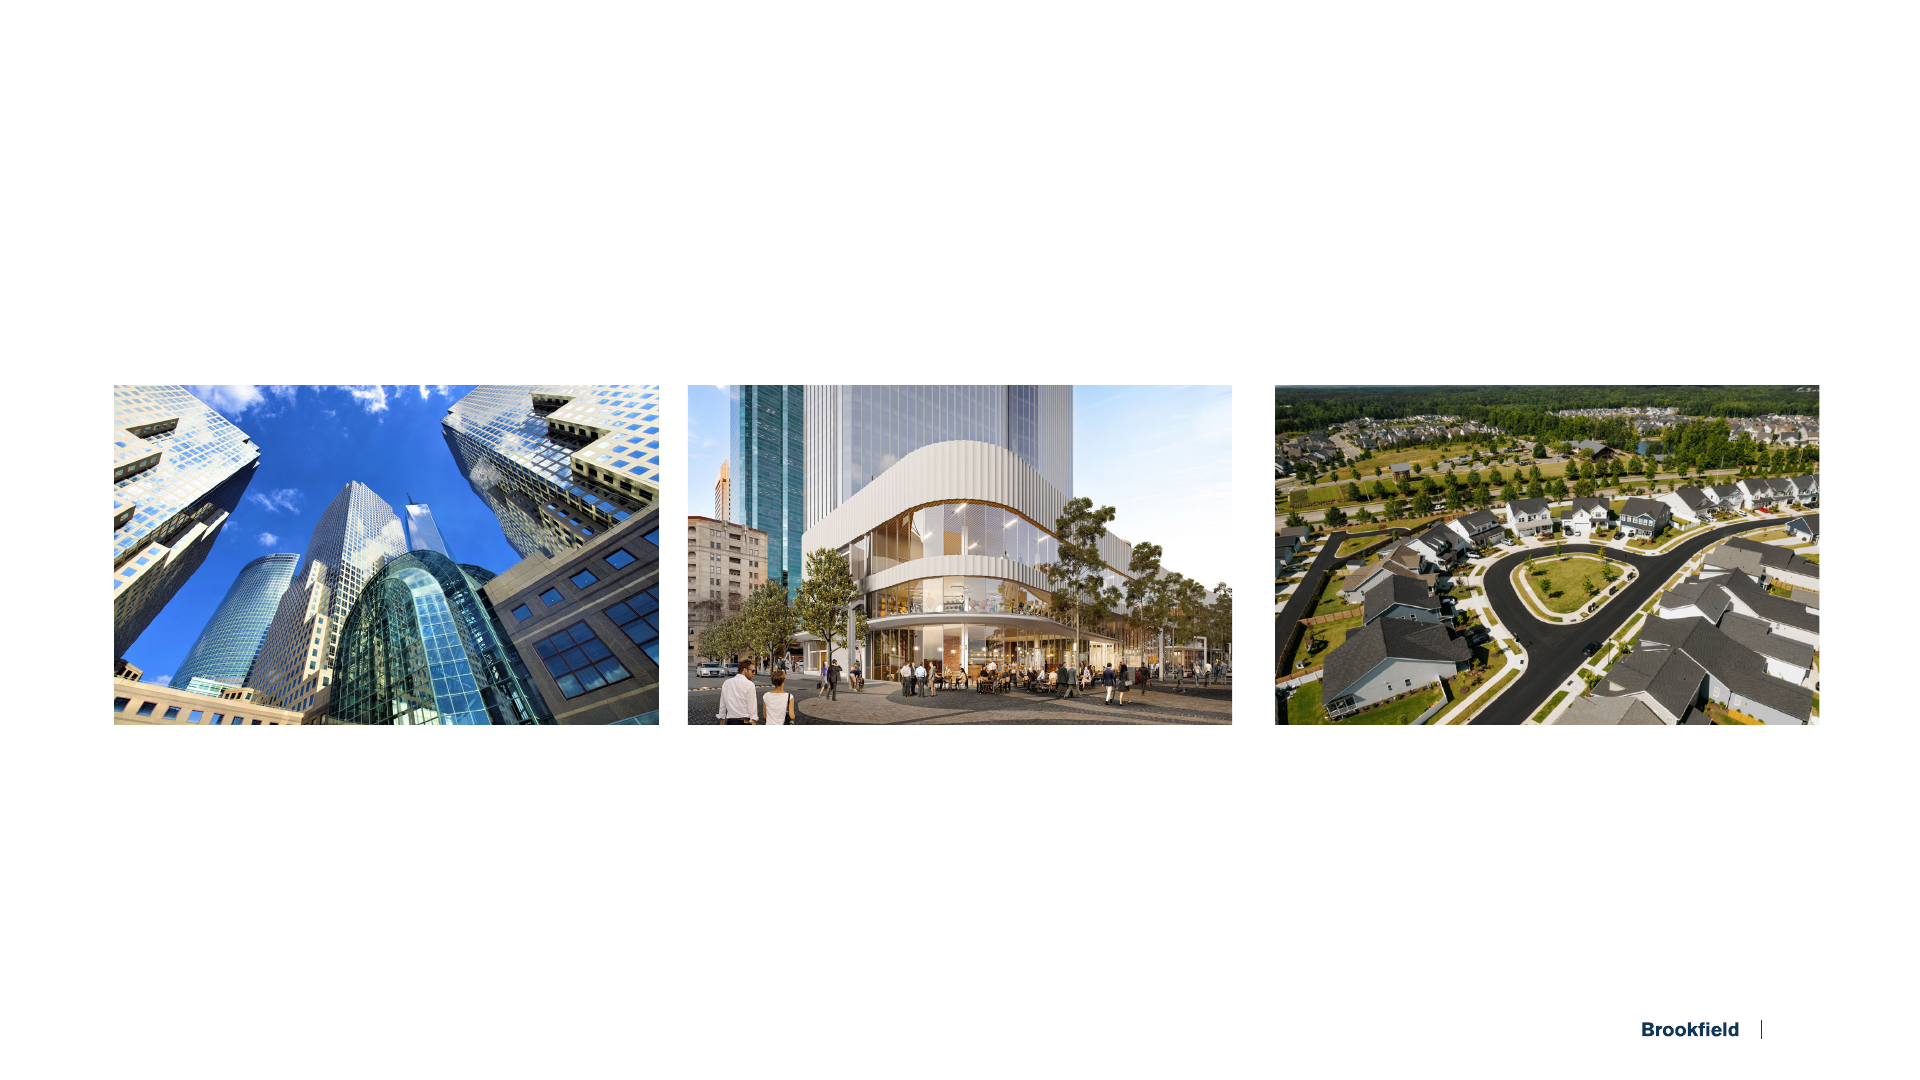
$24 billion of capital invested in real estate
Premier Core
Brookfield Place, New York
$14B
Transitional & Development
One The Esplanade, Perth
$7B
Residential
Wendell Falls Community, NC
$3B
98

Premier Core: Irreplaceable portfolio of 29 trophy mixed-use precincts
99
Luxury Retail
$6.7B
$14B
Luxury Urban Retail
$750M
Premier Office
$5.2B
Luxury Residential & Hotels
$1.6B
47%
8%
41%
4%

With strong underlying fundamentals
100
49%
LTV
96%
Occupancy
8 years
Lease Life
6%
SS NOI Growth
10
Trophy Commercial
Complexes
19
Irreplaceable
Shopping Centers

Robust same-store net operating income growth driven by…
Occupancy
Gains
Contractual
Rent Escalators
Mark-to-Market
Leases
101

Our debt maturities are well laddered
102
3%
16% 16%
15%
50%
2023 2024 2025 2026 2027+
Core Debt Maturities

$7.5 billion core office & mixed-use business
95%
Occupancy
4%
SS NOI Growth
9 years
Lease Life
100%
Zero Emissions Electricity
by 2026
Europe &
Middle East
$3B
55%
LTV
North
America
$4.5B
103

10 trophy commercial complexes…
As of June 30, 2023
Asset Asset Value Equity Value
Occupancy WALT
Premier Office
New York
Brookfield Place $ 4,519 $ 1,899 94% 8
Manhattan West 3,779 1,814 98% 10
300 Madison Avenue 1,232 435 100% 11
Grace Building 963 509 100% 10
London
Canary Wharf 3,410 1,303 93% 11
100 Bishopsgate 2,010 448 96% 16
Toronto
Brookfield Place 912 471 98% 6
Bay Adelaide Centre 841 463 98% 10
Other
Brookfield Place Dubai 699 381 92% 7
Potsdamer Platz Berlin 606 306 88% 6
Total
$ 18,971 $ 8,029
95% 9
Preferred shares & bonds
$ (2,800)
Total Equity Premier Office
$ 5,229
104

As of June 30, 2023
Asset City Asset Value Equity Value Occupancy WALT
Luxury Residential & Hotels
The Eugene New York $ 529 $ 215 95% N/A
Pendry Manhattan West New York 159
104
N/A N/A
Canary Wharf Residential London 2,145 1,308 94% N/A
Total $ 2,833 $ 1,627 95% N/A
Luxury Urban Retail
Brookfield Place Retail New York $ 449
$ 142
94% 7
Manhattan West Retail New York 226
142
98% 14
Canary Wharf Retail London 569 466 96% 7
Total $ 1,244 $ 750 96% 8
…and ancillary mixed-use
105

Occupancy Average RSF
BFPL NY
94% $ 73
Sub-Market
76% $ 57
Investment spotlight: Brookfield Place New York
Five-building, eight million sf mixed-use redevelopment
106
$4.5B
Stabilized
Value
6.5%
Discount
Rate
1.1M sf
Leases Signed
1
(at all-time record rents)
1. Leases signed in the last 18 months

Investment spotlight: Canary Wharf – London
20 million sf mixed-use precinct, including office, retail, homes & leisure space
128 Acres
Total Size
of Estate
$6.1B
Asset Value
$3.1B
Equity Value
2.3K+
Apartments
1M sf
Retail
8M sf
Office +
Lab Space
107

Canary Wharf
City of London
London City Airport
1991: DLR
1999: JUBILEE
2022: ELIZABETH LINE
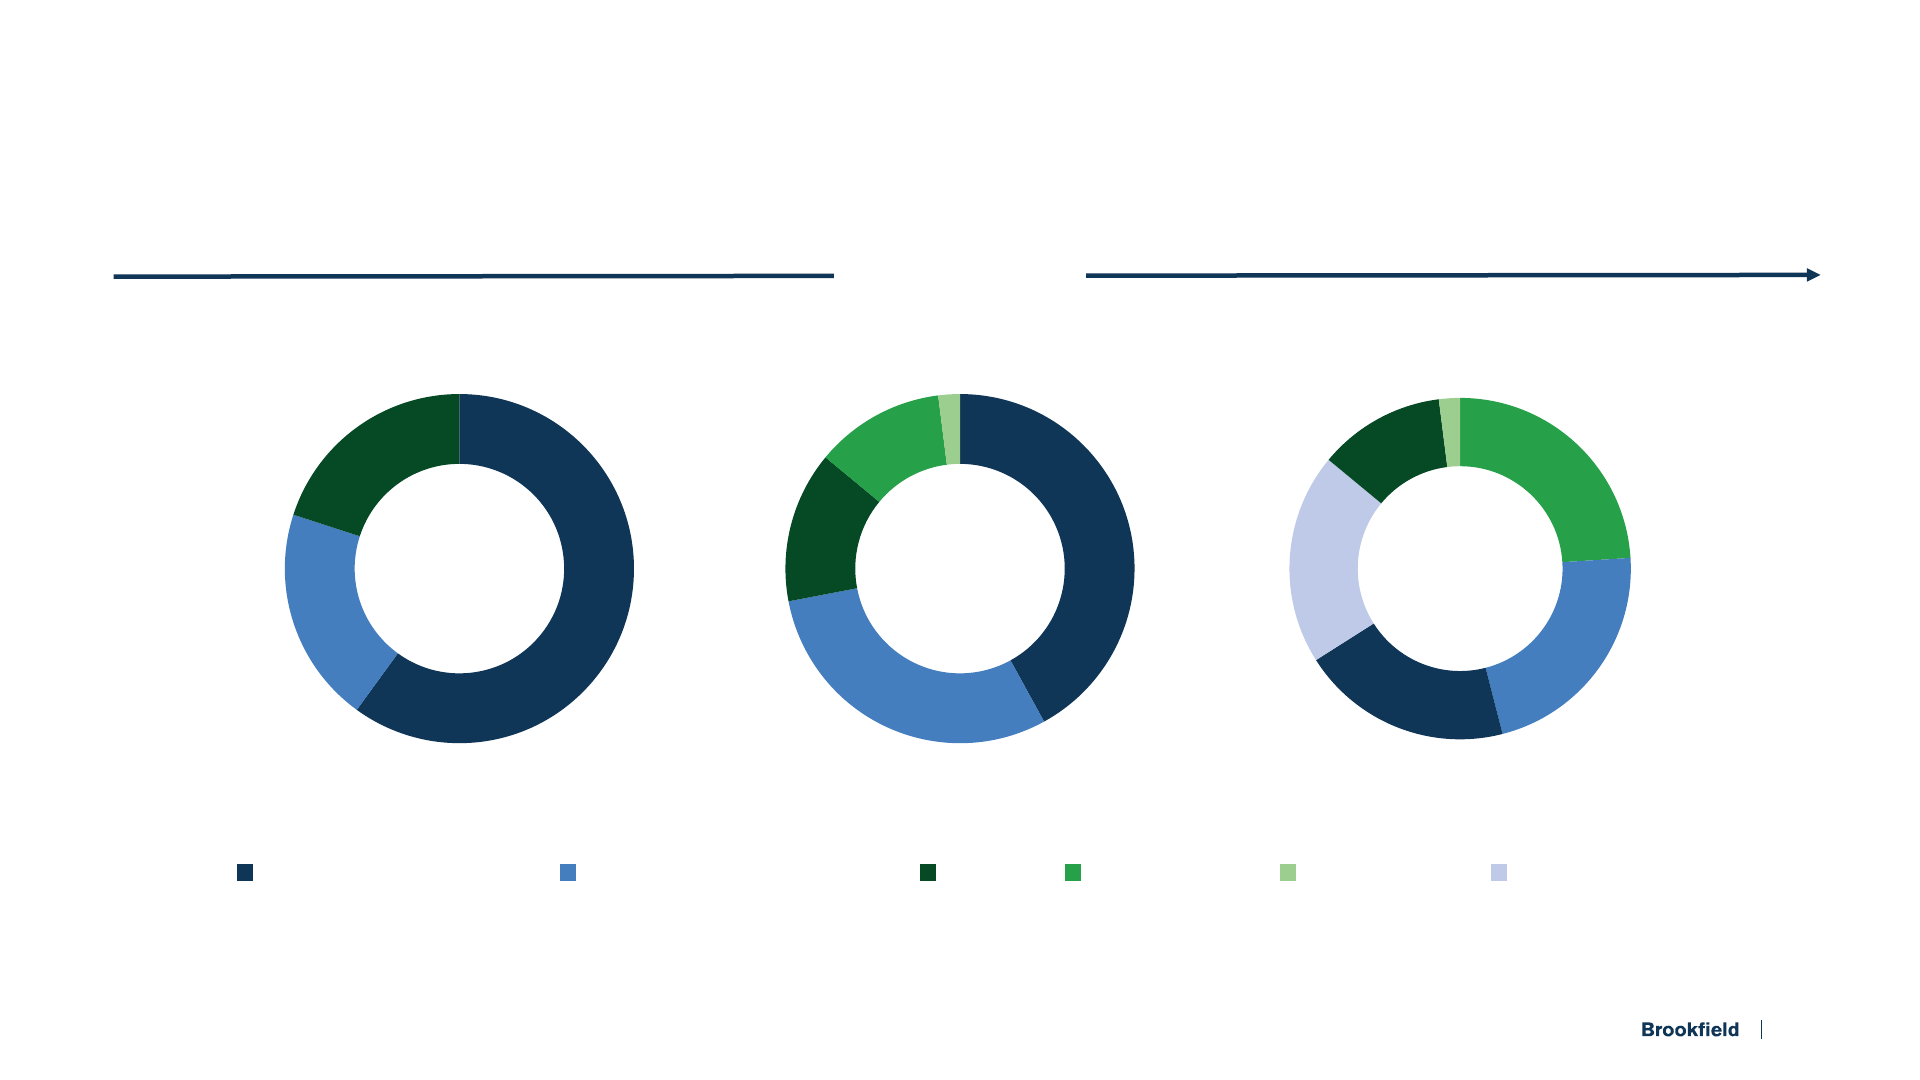
Evolution of CWG 3.0
109
42%
30%
14%
12%
2%
TODAY
24%
22%
20%
20%
12%
2%
CWG
3.0
60%20%
20%
2010
% of Value
20%
22%
12%
24%
2%
20%
Financial Services Other Office Tenants Retail Multifamily Hospitality Life Sciences

$6.7 billion core retail business
97%
Total Leased
10%
SS NOI Growth
6.2%
Discount Rate
41%
LTV
HI
CO
VA
NV
IL
NJ
CA
OH
MA
FL
NY
70%
Interim 2030 GHG
Emissions Intensity
Reduction Target
United States
19
Malls
111

19 irreplaceable shopping centers
As of June 30, 2023
Asset City Asset Value Equity Value Sales per sf
Luxury Retail
Ala Moana Center Honolulu $ 2,445 $ 1,346 $ 1,516
Park Meadows Lone Tree 1,285 644 1,015
730 Fifth Avenue New York 1,222 597 -
Tysons Galleria McLean 1,143 754 2,088
Fashion Show Las Vegas 1,025 643 1,050
The Grand Canal Shoppes Las Vegas 1,016 569 1,422
Oakbrook Center Oak Brook 904 697 1,279
Willowbrook Wayne 812 482 923
North Star Mall San Antonio 782 516 1,001
The Woodlands Mall Houston 778 364 822
Others (9) Multiple 4,348 2,671 1,003
Total $ 15,760 $ 9,283 $ 1,148
Preferred shares & bonds
$ (2,600)
Total Equity Luxury Retail
$ 6,683
112

$958
$1,148
Pre-pandemic Today
Tenant Sales PSF
1
$125
$131
Pre-pandemic Today
In Place Rent PSF
1
Continue to achieve strong performance in our core retail portfolio
113
+20%
Miami Design District, FL
Oakbrook Center, IL
+5%
1. Growth rate between 2019 and 2022 for tenants under 10k SF
Foot traffic increased +8% YTD compared to 2022

Investment spotlight: Tysons Galleria – McLean, VA
Largest and most productive assortment of luxury retail in the
Washington Metropolitan Area (sales of $2,088 per sf
1
)
114
Asset Name, Location
+45%
SS NOI Growth
vs. Pre-Pandemic
2022
$30M
+76%
Tenant Sales
1
Increase
vs. Pre-Pandemic
+4.8%
In-Place Rent Growth
1
vs. Pre-Pandemic
1. Tenants <10k SF
2023
$110M
Projected
Sales Volume

Transitional & Development: Maximize returns through a development
or buy-fix-sell strategy
Alderwood
Lynnwood, WA
Lilia Waikiki
Honolulu, Hawaii
One Leadenhall
London, UK
$7B
Equity Value
180
Properties
51%
LTV
5 years
Lease Life
116
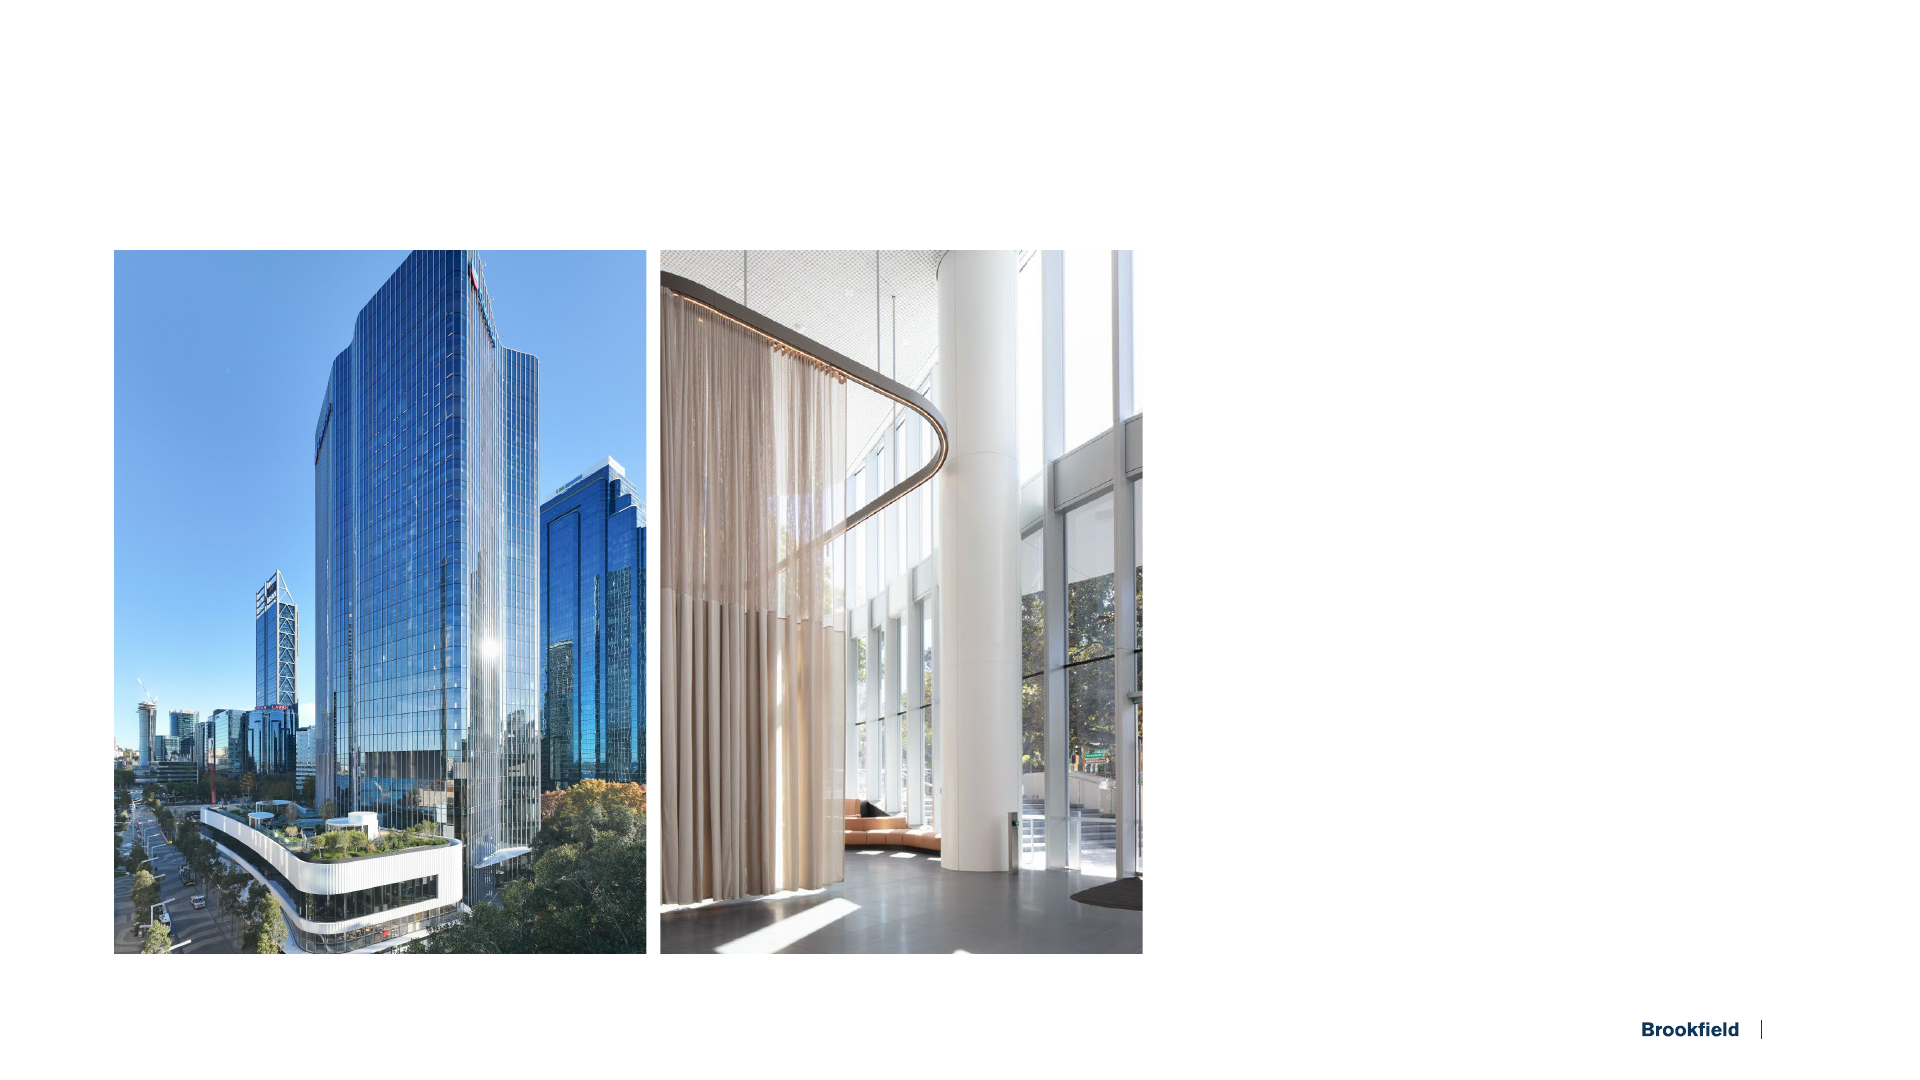
Investment spotlight: One The Esplanade – Perth, Australia
29-story mixed-use development
Market-leading sustainability credentials
• 6 Star Green Star Rating, including use of ‘green’
concrete that reduces CO
2
emissions
• First building in Australia to secure IWBI Well
Gold Core Rating
Significant Value Realized
Acquired in May 2019, sold 75% in 2020-21
$80M
Development Profit
100%
Leased (15-Year Lease)
5% cap rate
Record Sale for Perth Office
978.3%
Gross IRR
1
5.5x
Gross MOC
1
$18M
Equity Invested
1
1. Returns as at June 30, 2023. See Notice to Recipients and Endnotes
117
Asset Name, Location Asset Name, Location
97%
Total Retail
Occupancy
34%+
Reduction in Energy
Consumption Since 2014
+20%
Increase in Mall Tenant
Sales per sf vs. 2019
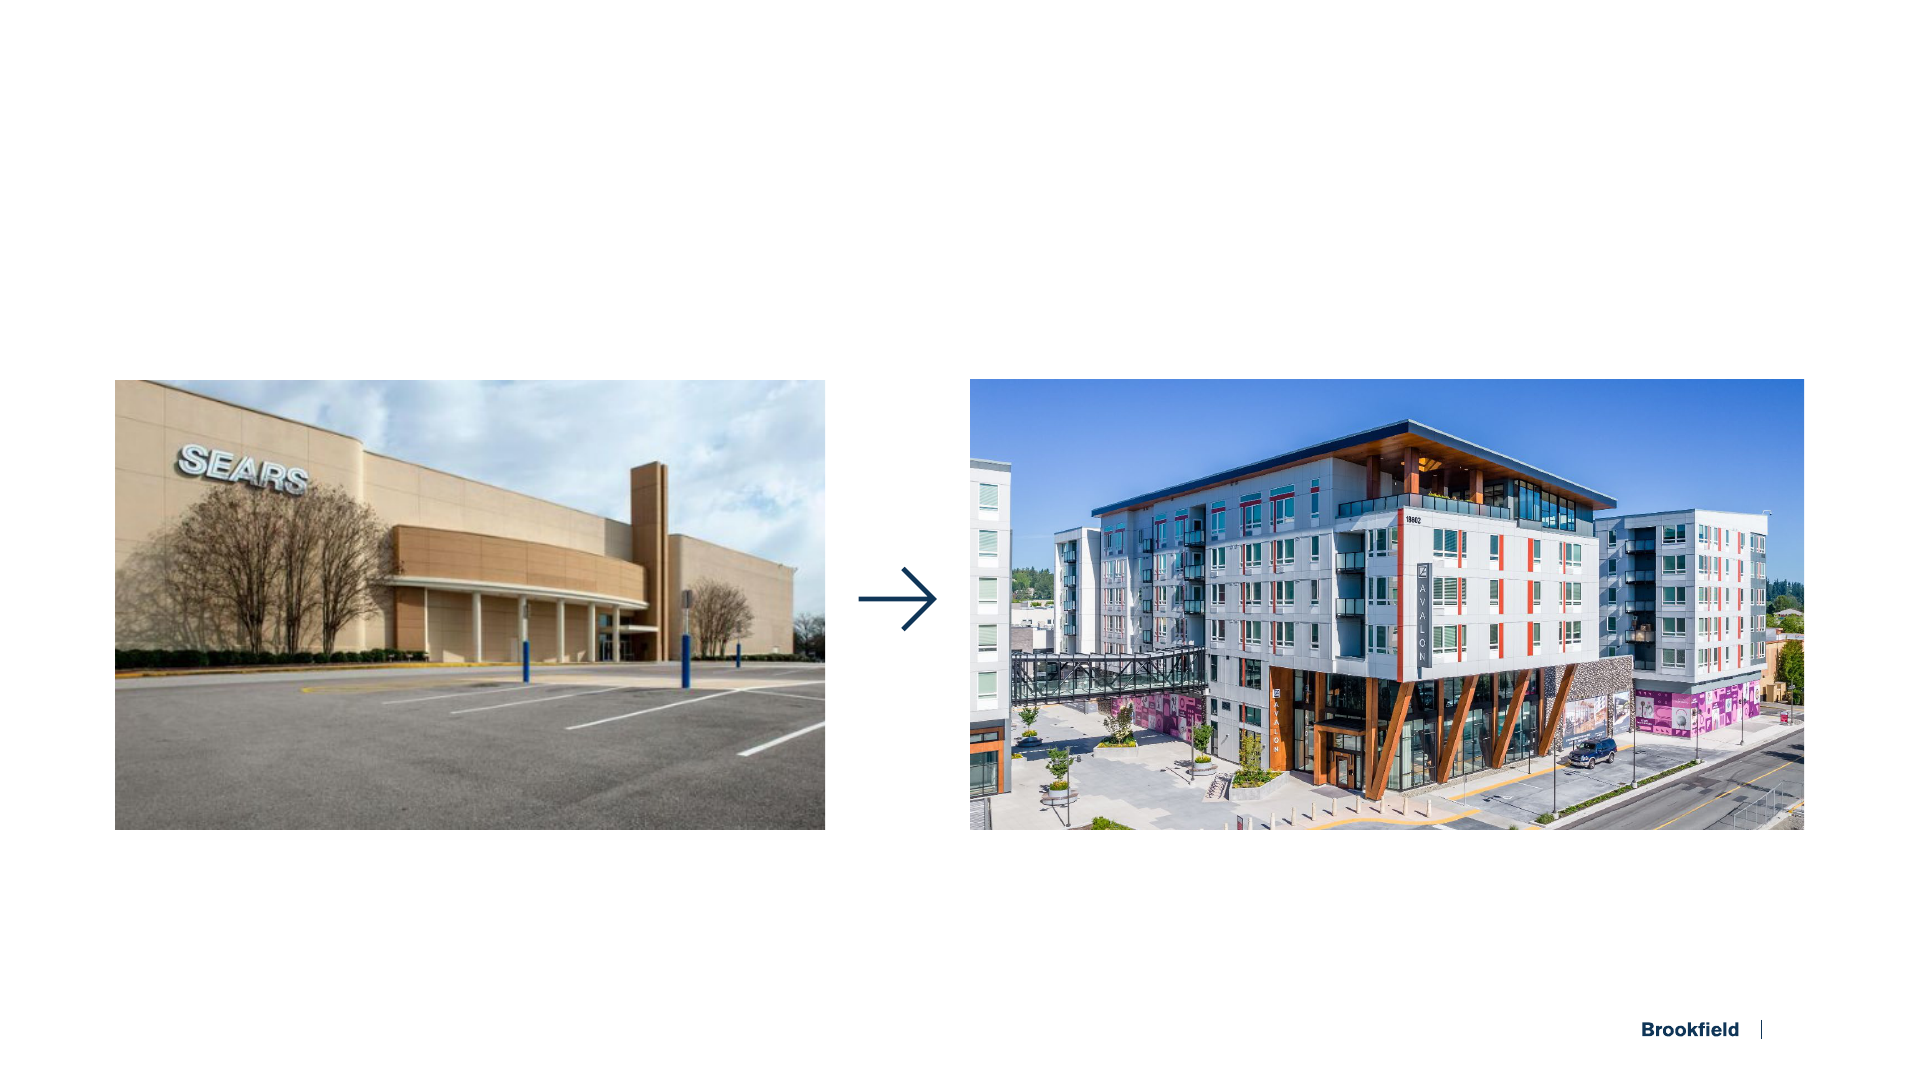
Investment spotlight: Alderwood Mall – Lynnwood, WA
Redevelopment of vacant anchor box into a mixed-use asset with
328 market-rate apartments and approximately 80,000 sf of new retail
Asset Name, Location
Nov. 2021
Grand Opening of Sears
Anchor Redevelopment
Before: Vacant Sears Box After: Alderwood Multifamily Development
95%
Multifamily Occupancy
at Rents Above Pro Forma
118

Residential: Create value through home building, lot sales and
development of commercial zones
$510M
Annual Operating Cash Flow*
2,340
Annual Home Sales*
83K
Lots in
20 Markets
2,330
Annual Lot Sales*
14%
Return on Equity*
* Figures represent LTM.
United
States
$2B
Canada
$1B
119

Real estate outlook
120
($ billions)
Today 2028
Equity Growth Sales Reinvest Future
Core
$ 14 3 (5) 1 $ 13
T&D
7 0 (7) 1 1
Residential
3 0.5 (3) 0.5 1
Total
$ 24B 3.5 (15) 2.5 $ 15B

In conclusion
121
• Strong fundamentals and tenant demand
• Short-term interest rates impact cash flows but not long-term values
• We have a well-laddered debt maturity profile to weather market volatility
• Real Estate will continue to generate compelling returns for Brookfield

Insurance Solutions
Sachin Shah, Chief Executive Officer

Executive Summary
123
• After three years, we have the base of a world class insurance business
• There is a compelling macroeconomic backdrop for this business
• We have built out the capabilities to scale from here
• Access to BAM’s investment expertise is a key differentiator to delivering outsized
returns on BN’s invested capital
• With very little extra capital we should be able to achieve $5B of earnings annually
• By 2026 the value of this business should be $30B

Macroeconomic tailwinds present
significant growth opportunities
for insurers
124

Over the next 20 years…
125
1. Source: Bloomberg.
$7T
Shortfall in
retirement
savings
>40%
Of the elderly
population to be
financially vulnerable
50%
Increase in U.S.
65+ population over
the next 20 years

We are building a long-term
yield plus growth business
126

Our distributable earnings
and capital generation
are growing quickly
127

Our path to $100 billion in assets positions us well
Pension Risk
Transfer
Multi-line Direct Origination
Specialty P&C
Scaled Annuity
Platform
$2B
AUM
$45B
AUM
$50B
AUM
$100B
AUM
Reinsurance
$15B
AUM
2020
2021
2022
2023
2023–2024
128

Our liabilities have an embedded cost advantage
129
~ 10
< $100K
average account size
< 4%
average cost of funds
year average life
1. See Notice to Recipients and Endnotes, including endnote 13.

While maintaining a low risk profile
A/A-
Rated operating
platform
1
$30B
Liquidity
BBB+
Investment Portfolio
Benefitting our Policyholders
130
1. S&P, Fitch, AM Best.
2. See Notice to Recipients and Endnotes, including endnote 13.

Our asset base is turning over quickly
~ 4 years
~ 10 years
Assets
Liabilities
131

At the perfect time…
132

The rate environment is highly constructive
Rates are
normalizing
Credit is an
attractive asset class
Banks continue
to retreat
133

We have the leading Investment Franchise
perfectly aligned with Insurance
Infrastructure Real Estate
Credit
That generates over $50 billion of proprietary credit deal flow annually
134

• Public Credit
• Real Estate Senior Credit
• Infrastructure Senior Debt
• Credit Secondaries
• Performing Credit
• Opportunistic Credit
• Direct Lending
• Consumer Finance
• Land Leases
• NAV Lending
• Royalties
• Core Real Estate
• Core Infrastructure
• Core-plus Infrastructure
• Value-add Transition
135
Our credit franchise is growing

Driving market leading investment yields
Assets $100 billion
Investment yield ~6%
Costs ~4%
Spread 2%
Annual cash yield $2 billion
Which we should be able to achieve by 2026
136
1. See Notice to Recipients and Endnotes, including endnotes 5 and 13.

To summarize where we are today
• The business we have today has $100 billion in assets and can generate $2 billion
of Distributable Earnings in the near term
• We have an unparalleled investment franchise to deploy the capital
• A highly scalable operating platform to deliver future growth
• Low-risk approach with long-duration liabilities and substantial liquidity
137

PLUS, we are still in the
early stages of our growth plan
138

Repeatable annual annuity franchise
Leading annuity platform Operating synergies
Best-in-class claims management
Trusted brand recognition
139
We have a market leading annuity engine driving our organic growth

Run-rate annuity generation
1
$20+
$10–12
Brookfield capabilities
140
1. See Notice to Recipients and Endnotes, including endnotes 5 and 13.
We can write $20 billion of long-duration annuities annually
with our in-house platform and operational capabilities

Operations can support $100 billion of net new assets in five years
$2B
Run-rate
distributable
earnings
1
10x
Initial
insurance
leverage
$20B
Annual
self-funded
growth
141
1. See Notice to Recipients and Endnotes, including endnote 5.
Which can be self-funded through re-investment of earnings

The foundation is in place to significantly grow our assets
through organic and inorganic channels
$20B
In net annuity
sales annually
$10-15B
PRT
$10-15B
Large-Block
Reinsurance
$100B
Self-Funded
Reinsurance
Growth Capital
142
1. See Notice to Recipients and Endnotes, including endnote 5.

Setting the business up to more
than double again
143

Contributing over $5 billion of Distributable Earnings
Today
Asset
Rotation
Annuities
Reinsurance
& Other
$5B
$2B
AEL
Argo
725
$1.2B
Today
Fully Ramped
~2026
$4B
2030
Self-Funded
2030
Total
144
1. See Notice to Recipients and Endnotes, including endnotes 5 and 13.

Brookfield Reinsurance will contribute
significant value to BN
for decades
145

Stable, recurring investment income
Predictable, low risk liabilities
Diversified source of earnings
Perpetual capital
Significant, self-funded growth
Supporting a 15x earnings multiple
146
Our business is positioned to drive outsized returns which should result
in higher quality earnings and a strong valuation multiple

$18B$8B
Pro-forma known
acquisitions
June 30, 2023
147
1. See Notice to Recipients and Endnotes, including endnotes 3 and 7.
Our strategic initiatives have driven a meaningful value uplift
Pro-Forma 2026 2030
Earnings $ 1.2B $ 2B $ 5B
Multiple 15x 15x 12x
Valuation $ 18B $ 30B $ 60B
Per BN share $ 11 $ 19 $ 37
Our business profile supports a compelling value proposition
148
1. See Notice to Recipients and Endnotes, including endnotes 3 and 13.
Which we believe is ascribed little value in BN's share price today

In a few short years, we have created a market leading insurance franchise
• Grown from zero to $100 billion in assets
• Have a credible path to $2 billion of DE
• Redeployed assets to earn attractive returns on BN’s invested capital
• Established a platform that can self-fund significant growth and double again
• Delivering significant and growing value to BN shareholders
And we are still in the early innings of Brookfield’s next global champion
149


1. Our outlook on the equity value and respective shares of Brookfield is based on (i) net generated carried interest, (ii) a 10x multiple to net target carried interest, as adopted by management in its business
planning, and (iii) our accumulated unrealized carried interest balance.
2. The value of our carried interest within our Plan Value assumes a 70% and 50% margin on gross generated carried interest, for Brookfield and Oaktree, respectively. Brookfield's estimates reflect the
appropriate multiple applied to carried interest in the alternative asset management industry based on, among other things, industry reports. These factors are used to translate earnings metrics into value in
order to measure performance and value creation for business planning purposes. The value of our capital within our Plan Value represents blended value, which is the quoted value of listed investments and
IFRS value of unlisted investments. We primarily value our real estate business by using fair value under IFRS, which we revalue on a quarterly basis, and comparable market data for our North American
residential business. In addition, we reflect our Insurance Solutions business based on management’s view of the fair value of this business.
3. Illustrative Plan Value analysis is not intended to forecast or predict future events, but rather to provide information utilized by Brookfield in measuring performance for business planning purposes, based on
the specific assumptions and other factors described herein and in our Notice to Recipients.
4. Insurance assets are presented pro-forma for the recently announced acquisitions, including the American Equity Life and Argo Group transactions.
5. References to growth in or future expectations for Distributable Earnings Before Realizations, Distributable Earnings, Fee-Bearing Capital, Fee Revenues, Annual Generated Carry, Accumulated Unrealized
Carry, Realized Carry and Carry-Eligible Capital are illustrative only. Actual results may vary materially and are subject to market conditions and other factors and risks, as well as certain assumptions, that are
set out in our Notice to Recipients.
6. Growth in Plan Value relating to cash retained includes cashflow from our existing businesses and realized carried interest. Excess cash flows are generally reinvested at 8%. Capitalization and dividends paid
out during the period assume a constant capitalization level and 7% annual growth.
7. The 2023 value of our Insurance Solutions business represents the intrinsic value as at June 30, 2023, excluding the impact of the recently announced acquisitions.
8. The actual realized returns on current unrealized investments may vary materially and are subject to market conditions and other factors and risks that are set out in our Notice to Recipients.
9. The target returns set forth herein are for illustrative and informational purposes only. Target gross returns are based on historical performance for similar investment strategies and the manager’s expectations
regarding the returns that it will underwrite for the types of investment opportunities that it expects to be available for the fund. There can be no assurance that the manager will be able to source investment
opportunities that it can underwrite in line with the target gross returns, or that the underwritten returns for any of the fund’s investments will be achieved. Target gross returns do not reflect fund expenses,
management fees or carried interest (or equivalent fees), which reduce an investor’s returns whereas target net includes these items. Due to various risks, uncertainties, and changes (including changes in
economic, operational, political or other circumstances), the actual performance of the fund could differ materially from the target returns set forth herein. In addition, industry experts may disagree with the
assumptions used in presenting the target returns. No assurance, representation or warranty is made by any person that the target returns will be achieved, and undue reliance should not be put on them.
Additional information about the assumptions used in determining the target returns are available upon request. Prior performance is not indicative of future results and there can be no guarantee that the fund
will achieve the target returns or be able to avoid losses.
Endnotes
152

10. Performance metrics are presented for flagship and predecessor funds along with similar strategies and do not include all Brookfield or Oaktree funds. Composite returns presented are calculated by
aggregating total cash flows of such funds, using the same information used to calculate the returns for each individual fund. “Gross IRR” and “Gross Investment Multiple” reflect performance before fund
expenses, management fees and carried interest (or equivalent fees), which would reduce an investor’s return. The actual realized returns on current unrealized investments may differ materially from the
returns shown herein, as it will depend on, among other factors, future operating results, the value of the asset and market conditions at the time of dispositions, any related transactions costs and the time and
manner of sale, all of which may differ from the assumptions on which the valuations contained herein are based. “Net IRR” and “Net Investment Multiple” take into account fund expenses, management fees
and carried interest (or equivalent fees) and take into account the effects of leverage incurred at the fund-level through the use of a subscription secured credit facility to temporarily fund investments and meet
working capital needs. As a result, “Net IRR” and “Net Investment Multiple presented may be materially higher than what they would have been without the use of such facility. The returns in this presentation
are hypothetical and do not represent the investment performance or the actual accounts of any investors or any funds. The investments included in calculating the performance presented were made through
different fund structures and therefore, may have different applicable fee and expense rates and do not represent returns actually achieved by any investor. Returns are subject to other factors and risks as set
out in our Notice to Recipients.
11. Gross IRR on current Brookfield private funds is on existing carry eligible funds, excluding open-ended funds and funds categorized as “Other” in Brookfield’s Q2 2023 Supplemental Information available at
brookfield.com.
12. Current gross realized carried interest expectations are illustrative only. Actual results may vary materially and are subject to market conditions and other factors and risks, as well as certain assumptions, that
are set out in our Notice to Recipients.
13. Insurance Solutions asset and liability values, including the impact of recently announced acquisitions.
14. Distributable Operating Earnings from our Insurance Solutions business are presented pro-forma for the recently announced acquisitions.
15. Growth in free cashflow includes growth in distributions from listed investments, assuming dividend growth in line with historical distribution rate growth over the plan period, and 5% growth in corporate costs,
and assumes current capitalization. Actual results may vary materially and are subject to market conditions and other factors and risks that are set out in our Notice to Recipients.
16. 2023 and 2022 figures are adjusted for the special distribution of 25% of our asset management business that we completed in December 2022.
153
Endnotes

INVESTOR DAY 2023 – NOTICE TO RECIPIENTS
Brookfield is not making any offer or invitation of any kind by communication of this document to the recipient and under no circumstances is it to be construed as a prospectus or an advertisement.
Except where otherwise indicated herein, the information provided herein is based on matters as they exist as of June 30, 2023 and not as of any future date, is subject to change, and, unless required by law, will
not be updated or otherwise revised to reflect information that subsequently becomes available or circumstances existing or changes occurring after the date hereof.
Unless otherwise noted, all references to “$” or “Dollars” are to U.S. Dollars.
CAUTIONARY STATEMENTS REGARDING FORWARD-LOOKING STATEMENTS AND INFORMATION
This presentation contains “forward-looking information” within the meaning of Canadian provincial securities laws and “forward-looking statements” within the meaning of the U.S. Securities Act of 1933, the U.S.
Securities Exchange Act of 1934, and “safe harbor” provisions of the United States Private Securities Litigation Reform Act of 1995 and in any applicable Canadian securities regulations.
Forward-looking statements include statements that are predictive in nature, depend upon or refer to future events or conditions, include, but are not limited to, statements which reflect management’s
expectations regarding the operations, business, financial condition, expected financial results, performance, prospects, opportunities, priorities, targets, goals, ongoing objectives, strategies and outlook of
Brookfield Corporation and its affiliates, as well as the outlook for North American and international economies for the current fiscal year and subsequent periods. Often, but not always, forward-looking information
can be identified by the use of forward-looking terminology such as “expects,” “likely,” “anticipates,” “plans,” “believes,” “estimates,” “seeks,” “intends,” “targets,” “projects,” “forecasts,” or negative versions thereof
and other similar expressions, or future or conditional verbs such as “may,” “will,” “should,” “would” and “could.” In particular, the forward-looking statements contained in this presentation include statements
referring to the impact of current market or economic conditions on our businesses, the future state of the economy or securities market, the expected future trading price of our shares or financial results, the
results of future fundraising efforts, the expected growth, size or performance of future or existing strategies, future investment opportunities, or the results of future asset sales. In addition, forward-looking
statements contained in this presentation include statements regarding recently announced acquisitions by our Insurance Solutions business, including the anticipated timing and value of such transaction and the
impact that such transaction may have on Brookfield and its shareholders. The transaction will be subject to the satisfaction of a number of conditions, including regulatory approvals, and, as such, there can be
no certainty that the transactions will close as anticipated within the expected timelines.
Below are certain of the forward-looking statements that are contained in this presentation and a number of assumptions underlying them.
Where this presentation refers to realized carried interest or carried interest, carried interest for existing funds is based on June 30, 2023, carry eligible capital or carried interest for future funds is based
on Brookfield’s estimates of future fundraising as at June 30, 2023, as described below. In addition, this presentation assumes that existing and future funds meet their target gross return. Target gross returns are
typically 20+% for opportunistic funds; 13% to 15% for value-add funds; 12% to 15% for credit and core plus funds. Fee terms vary by investment strategy (carried interest is approximately 15% to 20% subject to
a preferred return and catch-up) and may change over time. This presentation assumes that capital is deployed evenly over a four-year investment period and realized evenly over three years of sales. The year
in which such sales commence varies by investment strategy and ranges from year 6 to year 10.
Where this presentation refers to the growth in fee-bearing capital we assume that flagship funds are raised every two to three years based on historical fund series and non-flagship funds are raised annually
within certain strategies, and in other strategies every two to three years. Unless otherwise stated, we assume that growth in fund series’ sizes remains consistent with historical growth rates. This presentation
also assumes that distributions are based on fund realizations evenly over the last years of fund life. The year in which such sales commence varies by investment strategy.
References to distribution, growth, market valuation, and issuances relating to perpetual affiliates, include the following assumptions: (i) BEP and BIP grow over the plan period in line with historical
distribution rate growth, assuming current yield; (ii) BBU share price grows at a 12% annual rate; and (iii) total listed partnership capitalization includes issuances related to shares, debt and preferred equity for
BIP and BEP.
Notice to Recipients
154

Where this presentation refers to growth in fee-related earnings, growth is in accordance with growth in fee-bearing capital. The management fees for BEP are based on fixed fees on initial capitalization and an
additional fee of 1.25% on the amount in excess of initial capitalization. Management fees for BIP and BBU are 1.25% of total capitalization. Fee terms for private funds vary by investment strategy (generally,
within a range of approximately 1-2%). The incentive distribution rights of the perpetual affiliates are based on growth over the plan period in line with historical distribution rate growth as described above. Other
fees include the BBU performance fee assuming a 10% BBU annual share price growth. We use a combined margin rate in the range of 55% – 65% on fee revenues for planning purposes.
Although we believe that our anticipated future results, performance or achievements expressed or implied by the forward-looking statements and information are based upon reasonable assumptions and
expectations, the reader should not place undue reliance on forward- looking statements and information because they involve known and unknown risks, uncertainties and other factors, many of which are beyond
our control, which may cause our and our subsidiaries’ actual results, performance or achievements to differ materially from anticipated future results, performance or achievements expressed or implied by such
forward-looking statements and information.
Some of the factors, many of which are beyond Brookfield’s control and the effects of which can be difficult to predict, but may cause actual results to differ materially from those contemplated or implied by forward-
looking statements include, but are not limited to: (i) investment returns that are lower than target; (ii) the impact or unanticipated impact of general economic, political and market factors in the countries in which
we do business including as a result of COVID-19 and the related global economic shutdown; (iii) the behavior of financial markets, including fluctuations in interest and foreign exchange rates; (iv) global equity
and capital markets and the availability of equity and debt financing and refinancing within these markets; (v) strategic actions including dispositions; the ability to complete and effectively integrate acquisitions into
existing operations and the ability to attain expected benefits; (vi) changes in accounting policies and methods used to report financial condition (including uncertainties associated with critical accounting
assumptions and estimates); (vii) the ability to appropriately manage human capital; (viii) the effect of applying future accounting changes; (ix) business competition; (x) operational and reputational risks;
(xi) technological change; (xii) changes in government regulation and legislation within the countries in which we operate; (xiii) governmental investigations; (xiv) litigation; (xv) changes in tax laws; (xvi) ability to
collect amounts owed; (xvii) catastrophic events, such as earthquakes, hurricanes, or pandemics/epidemics; (xviii) the possible impact of international conflicts and other developments including terrorist acts and
cyberterrorism; (xix) the introduction, withdrawal, success and timing of business initiatives and strategies; (xx) the failure of effective disclosure controls and procedures and internal controls over financial
reporting and other risks; (xxi) health, safety and environmental risks; (xxii) the maintenance of adequate insurance coverage; (xxiii) the existence of information barriers between certain businesses within our
asset management operations; (xxiv) risks specific to our business segments including our real estate, renewable power, infrastructure, private equity, insurance solutions, and credit; and (xxv) factors detailed
from time to time in our documents filed with the securities regulators in Canada and the United States.
We caution that the foregoing list of important factors that may affect future results is not exhaustive. When relying on our forward-looking statements, investors and others should carefully consider the foregoing
factors and other uncertainties and potential events. Except as required by law, we undertake no obligation to publicly update or revise any forward-looking statements or information in this presentation, whether as
a result of new information, future events or otherwise.
Notice to Recipients (cont’d)
155

CAUTIONARY STATEMENT REGARDING PAST AND FUTURE PERFORMANCE AND TARGET RETURNS
Past performance is not indicative nor a guarantee of future results. There can be no assurance that comparable results will be achieved in the future, or that future investments or fundraising efforts will be similar
to the historic results presented herein (because of economic conditions, the availability of investment opportunities or otherwise). Any information regarding prior investment activities and returns contained herein
has not been calculated using generally accepted accounting principles and has not been audited or verified by an auditor or any independent party.
The target returns set forth herein are for illustrative and informational purposes only and have been presented based on various assumptions made by Brookfield, any of which may prove to be incorrect. There
can be no assurance that targeted returns, fundraising efforts, diversification, or asset allocations will be met or that an investment strategy or investment objectives will be achieved. Due to various risks,
uncertainties and changes (including changes in economic, operational, political or other circumstances) beyond Brookfield’s control, the actual performance of the funds and the business could differ materially
from the target returns set forth herein. In addition, industry experts may disagree with the assumptions used in presenting the target returns.
Any changes to assumptions could have a material impact on projections and actual returns. Actual returns on unrealized investments will depend on, among other factors, future operating results, the value of the
assets and market conditions at the time of disposition, legal and contractual restrictions on transfer that may limit liquidity, any related transaction costs and the timing and manner of sale, all of which may differ
from the assumptions and circumstances on which the valuations used in the prior performance data contained herein are based. Accordingly, the actual realized returns on unrealized investments may differ
materially from the returns indicated herein.
No assurance, representation or warranty is made by any person that the target returns will be achieved, and undue reliance should not be put on them. Prior performance is not indicative of future results and
there can be no guarantee that the funds will achieve the target returns or be able to avoid losses.
STATEMENT REGARDING USE OF NON-IFRS MEASURES
This presentation contains references to financial measures that are calculated and presented using methodologies other than in accordance with International Financial Reporting Standards (“IFRS”), as issued by
the International Accounting Standards Board (“IASB”). We utilize these measures in managing the business, including for performance measurement, capital allocation and valuation purposes and believe that
providing these performance measures on a supplemental basis to our IFRS results is helpful to investors in assessing the overall performance of our businesses. These financial measures should not be
considered as the sole measure of our performance and should not be considered in isolation from, or as a substitute for, similar financial measures calculated in accordance with IFRS. We caution readers that
these non-IFRS financial measures or other financial metrics may differ from the calculations disclosed by other businesses and, as a result, may not be comparable to similar measures presented by other issuers
and entities. For a more fulsome discussion regarding our use of non-IFRS measures and their reconciliation to the most directly comparable IFRS measures refer to our documents filed with the securities
regulators in Canada and the United States.
OTHER CAUTIONARY STATEMENTS
This presentation includes estimates regarding market and industry data that is prepared based on management's knowledge and experience in the markets in which we operate, together with information obtained
from various sources, including publicly available information and industry reports and publications. While we believe such information is reliable, we cannot guarantee the accuracy or completeness of this
information and we have not independently verified any third-party information.
The information in this Investor Presentation does not take into account your investment objectives, financial situation or particular needs and nothing contained herein should be construed as legal, business or tax
advice. Each prospective investor should consult its own attorney, business adviser and tax advisor as to legal, business, tax and related matters concerning the information contained herein.
Notice to Recipients (cont’d)
156
