
Annual Report
December 31, 2023
Loomis Sayles International Growth Fund
Natixis Oakmark Fund
Natixis Oakmark International Fund
Natixis U.S. Equity Opportunities Fund
Vaughan Nelson Mid Cap Fund
Vaughan Nelson Small Cap Value Fund
IMPORTANT NOTICE TO SHAREHOLDERS
The Securities and Exchange Commission (SEC) has adopted new regulations that will result in changes to the design and delivery of annual
and semiannual shareholder reports. Beginning in July 2024, Funds will be required by the SEC to send shareholders a paper copy of a new
tailored shareholder report in place of the full shareholder report that is currently being provided. If you would like to receive shareholder
reports and other communications from the Funds electronically, instead of by mail, you may make that request at www. icsdelivery.com/
natixisfunds. If you have already elected to receive shareholder reports electronically, you will not be affected by this change, and you need not
take any action.
Table of Contents
Portfolio Review 1
Portfolio of Investments 35
Financial Statements 47
Notes to Financial Statements 79

Managers
Aziz V. Hamzaogullari, CFA®
Loomis, Sayles & Company, L.P.
Symbols
Class A LIGGX
Class C LIGCX
Class N LIGNX
Class Y LIGYX
Investment Goal
The Fund's investment goal is long-term growth of capital.
Market Conditions
International equities delivered strong, double-digit total returns in 2023, with much of the gain occurring in November and
December. The asset class generally per formed well in the first half of the year, with stocks trending higher in choppy trade amid
expectations that central banks’ interest-rate increases were largely nearing their conclusion. Sentiment shifted in the third quarter,
however, as worries mounted that central banks would need to keep interest rates “higher for longer.”The international equity markets
experienced a protracted decline in the August-October time frame as a result, bringing the major international indexes back near the
levels where they began the year. The outlook changed yet again in November, when a series of weaker-than-expected inflation reports
and comments from U.S. Federal Reserve officials indicated that not only were interest-rate increases largely concluded, but also that
rate cuts were likely to begin as soon as the first half of 2024. Stocks rose in response, helping the key indexes finish December near
their highs for the year.
The European markets were a key driver of performance for the broader asset class. Economic growth in the region exceeded the
depressed expectations that existed coming into 2023, when concerns about the effects of the war in Ukraine remained at the forefront.
Italy and Spain were top performers in Europe, as were the larger markets of Germany and France. The Asian markets, while posting
gains, lagged somewhat due to the more proximate impact of China’s sub-par growth.
Performance Results
For the 12 months ended December 31, 2023, Class Y shares of the Loomis Sayles International Growth Fund returned 20.81% at net
asset value. The Fund outperformed its benchmark, the MSCI All Country World Index ex USA Index (Net), which returned 15.62%.
Explanation of Fund Performance
We are an active manager with a long-term, private equity approach to investing. Through our proprietary bottom-up research
framework, we look to invest in those few high-quality businesses with sustainable competitive advantages and profitable growth when
they trade at a significant discount to intrinsic value. Given the rare confluence of quality, growth, and valuation, we may study doz ens
of companies but may only invest in a select few businesses each year. We believe identifying those few businesses with such
characteristics is an art, not a science. As a result of this rigorous approach, ours is a selective, high-conviction portfolio of typically
30–45 names.
The Fund’s positions in MercadoLibre, Novo Nordisk, and WiseTech Global contributed the most to performance. Stock selection in
the consumer discretionary, information technology, and healthcare sectors, along with our allocations in the information technology
sector, contributed positively to relative performance.
MercadoLibre is the largest online commerce platform in Latin America. The company offers its users an ecosystem of six integrated
e-commerce services that include its marketplace, payment and fintech solutions, shipping and logistics, advertising, classified listings,
and merchant web services. The company operates in 18 countries representing the vast majorit y of Latin American GDP, and its
148 million active users in 2022 represented approximately 30% of the region’s estimated 480 million internet users. We believe
MercadoLibre benefits from strong and sustainable competitive advantages that include its network and ecosystem, brand, and
understanding of local markets that collectively contribute to its leadership position in each market it serves. A Fund holding since
inception, the company delivered strong revenue growth that was consistently above consensus expectations, driven by growth in gross
merchandise volume and payments, and continued market share gains in both e-commerce and payments. MercadoLibre remains in an
elevated investment cycle to build out a more powerful ecosystem focused on greater product selection, easier payment options, wider
credit availability, and lower cost and faster speed of delivery. The company also expects to increase its investments in several areas,
including first-party sales, an improved loyalty program, and advertising technology. While these investments impact near-term
profitability, operating margins still expanded substantially and exceeded expectations throughout the period, and we believe the
investments have contributed to market share gains in e-commerce and payments and a stronger competitive position. We believe
management remains focused on balancing the investments needed to further improve user experience and extend the company ’s
LOOMIS SAYLES INTERNATIONAL GROWTH FUND
1
|
leadership in e-commerce and payments, while maintaining a sustainable and profitable financial model.With continued growth in
internet access, increasing availability of credit, and the company ’s continuing investments to improve the ease and convenience of
transacting online, we believe MercadoLibre remains well positioned for sustained growth over the next decade, driven by the secular
growth of e-commerce across Latin America. Over our forecast period, we believe the penetration of e-commerce can more than
double, which would bring the penetration rate into the mid-20% level.We believe the current market price embeds expectations for
key revenue and cash flow growth drivers that are well below our long-term assumptions. As a result, we believe the shares trade at a
significant discount to our estimate of intrinsic value and offer a compelling long-term reward-to-risk opportunity.
Headquartered in Denmark, Novo Nordisk is a global healthcare company with 100 years of innovation and leadership in diabetes
care. Over this time, Novo has amassed unparalleled experience in the biology of diabetes, expertise in protein science, and developed
significant competitive advantages as a result. Its diabetes products have captured approximately one-third of the global branded
diabetes care market, which along with its first-mover position in related obesity therapies account for over 90% of the company ’s
annual revenues. We believe Novo’s strong and sustainable advantages include its deep experience in diabetes care and therapeutic
proteins, strong infrastructure that took decades to build, efficient manufacturing techniques, robust pipeline, and economies of scale.
A Fund holding since inception, shares have been up strongly since early August when the company released results from a five-year
cardiovascular outcomes tr ial for Wegovy, the company’s newest GLP-1 treatment for obesity. Among non-type 2 diabetes obese
patients with established cardiovascular (CV ) disease, the therapy resulted in a 20% decrease in CV events such as CV death, heart
attack, and stroke, versus the placebo. The 17,500-person tr ial represents the first study evaluating the longer-term benefits that
GLP-1 therapies can provide to an obese population. The company’s financial results also reflected strong execution as year-to-date
sales rose 33% year over year, driven by strong uptake in GLP-1 therapies across both its diabetes and obesity-care franchises, and
operating profit grew 37%. The GLP-1 class of therapies are a quickly growing c lass of medications that while first documented in
1987, were first approved for type-2 diabetes in 2005 and later for obesity in 2014. The therapies are currently being tested in a range
of comorbidities including heart failure, sleep apnea, NASH (nonalcoholic steatohepatitis), and kidney disease. In the diabetes
indication, GLP-1 sales grew 49% year over year, contributing to the company’s nearly 55% total GLP-1 market share. In addition to
targeting diabetes with its GLP-1s, in 2021, Novo received approval for semaglutide (the same molecule behind its leading diabetes
therapies, Ozempic and Rybelsus) in the obesity setting under the brand name Wegovy. While operational challenges limited the
initial production of Wegovy, the company is seeing robust early
demand whic h contributed to 174% year-to-date sales growth in its
nascent obesity care franchise. Diabetes is a global epidemic with an estimated population of 530 million. The market has been
growing annually in the low double digits over the last ten years, driven by aging of the global population and increasing obesity.
Further, there are estimated to be almost 500 million non-diabetic obese people globally who may benefit from Novo’s therapies. We
believe Novo’s deep experience in diabetes care and leadership in the nascent obesity market, differentiated product suite, and leading
innovation should enable the company to grow revenues and free cash flow in the low double digits over our long-term investment
horizon. We believe the company ’s shares continue to sell at a meaningful discount to our estimate of intrinsic value and offer an
attractive reward-to-risk opportunity.
Wisetech Global is the leading software solutions provider to the global logistics industry. Founded in 1994 to provide freight-
forwarding and customs software to the Australian logistics industry, Wisetech solutions are used in whole or in part by over 85% of
the world’s 50 largest third-party logistics providers (3PLs) and almost all of the 25 largest freight forwarders, led by the company’s
primary SAAS (software-as-a-service) platform, CargoWise One. From a single unified platform, the company offers function-specific
and enterprise-wide modules that support the complex international movement of goods and create substantial efficiencies for its
logistics clients. The company’s vision is to become the world’s operating system for global logistics. A holding since Fund inception,
Wisetech reported financial results for its 2023 fiscal year ended June 2023 that reflected continued strong penetration of its end
markets and organic revenue growth in excess of 20%. After having substantially slowed its pace of acquisition activity in recent
quarters, the company announced two sizeable acquisitions in landside logistics earlier in the year, which continued to expand the
company ’s capabilities outside of forwarding to execute on
its strategy of building a universal operating system for global logistics.
However, shares pulled back midyear after the company disc losed that it expects the acquisitions to depress its operating margins for
the next few years. We do not believe the decline in margins is structural, and in our view, the company continues to execute well on its
long-term strategic vision. Outside of its acquisition activity, the company showed continued growth among its existing client base,
with every calendar-year cohort of new clients going back to 2006 showing growth over the pr ior year, continuing a multi-year trend.
We believe Wisetech benefits from strong and sustainable competitive advantages that include an installed client base with high
switching costs, its freight-forwarding industry expertise, significant investments in research and development, its brand, and network.
We believe Wisetech will benefit from secular growth in logistics software and services as companies increasingly move towards
outsourcing and away from less effective in-house solutions. With virtually no comparable off-the-shelf competition to its unified
global platform, Wisetech is the dominant market share leader in its legacy freight-forwarding market. We estimate the company now
captures over 20% share of its addressable freight forwarding market, up from the mid-single digits five years ago, with gains coming at
the expense of proprietary solutions or competitor offerings that addressed only limited industry functions or geographies. Through
underlying industry growth, continued market share gains in its legacy freight-forwarding market, and ongoing penetration of other
L
OO
MISSAYLES INTERNATI
O
NAL GR
O
WTH FUND
|
2
parts of the logistics industry performed by 3PLs, including warehouse management, land transportation, and cargo handling, we
believe the company can generate compounded annual revenue growth of approximately 20% over our long-term investment horizon,
with faster growth in operating profits and free cash flow as the company benefits from scale and operating leverage. Prior to the share
price drop that followed the company ’s lowered margin guidance, we meaningfully trimmed our position in the company, which had
been our largest position at the time. We continue to belie ve the expectations embedded in Wisetech’s share price underestimate the
company’s superior positioning and the sustainability of its growth. As a result, we believe the shares trade at a discount to our estimate
of intrinsic value and represent an attractive reward-to-risk opportunity.
The Fund’s positions in Yum China, Budweiser Brewing APAC, and Doximit y detracted the most from performance. Stock selection
in the consumer staples, industrials, and communication services sectors, as well as our allocations in the consumer staples, healthcare,
industrials, consumer discretionary, financials, and communication services sectors, detracted from relative performance.
Yum China is the largest restaurant company in China, operating over 14,000 restaurants primarily under the KFC and Pizza Hut
brands. A Fund holding since inception, Yum China reported financial and operating results throughout the period that we believe
reflected the company ’s success in navigating a challenging China consumer spending environment that was still impacted by
Covid-19 and related restrictions in the early part of the year. Shares responded negatively to the company ’s most recent quarterly
financial results that were below consensus expectations, despite including record revenues, operating profits, and net new store
openings. The company observed a noticeable slowdown in consumer traffic in September 2023 that continued into the fourth quarter
as macroeconomic weakness persists and more local competitors have returned to the market as China continues to normalize post
Covid. This near-term economic weakness does not affect our structural investment thesis for the company, which continues to expand
into lower-tier cities while consistently innovating to sustain consumer purchases – especially among its over 460 million loyalty
members. We also believe the company has the products and scale to offer increasingly value-conscious consumers attractive food
options at all price points. We believe Yum China’s strong and sustainable competitive advantages include its exclusive license to
operate and franchise two of the most prominent restaurant brands in China, the scale of its distribution and supply chain
infrastructure, a first-mover advantage in real estate procurement, which allows the company to identify the best locations with respect
to traffic flow and thereby offer the most convenient service, and decades of experience in restaurant operations. The Chinese economy
is transitioning to a consumption-driven economy, following a path similar to that of other developing economies. We believe this will
fuel future consumption spending, including expenditures in restaurants, as food options such as Pizza Hut and KFC become
increasingly affordable to an emerging middle class with rising levels of disposable income. With its iconic brands, large and complex
supply chain infrastructure, and real estate procurement expertise, we believe Yum China remains well positioned to benefit from the
secular growth of consumer spending on restaurants in China. We believe the current market price embeds expectations for free cash
flow growth that are well below our long-term estimates. As a result, we believe the company is selling at a significant discount to our
estimate of intrinsic value, and offers a compelling reward-to-risk opportunity.
Budweiser Brewing Company APAC Ltd (Bud APAC) is the Asia-Pacific division of Anheuser-Busch InBev (AB InBev), the world’s
largest beer brewer and distributor. The company became a publicly traded entity following its September 2019 initial public offering
(IPO) and remains 87% owned by AB InBev. Bud APAC is the market share leader in its two largest markets, China and South
Korea, which account for over 90% of revenues. The company sells over 50 brands across all segments of the beer market, but is
focused on the premium segments where it is the regional leader. We believe Bud APAC’s strong and sustainable competitive
advantages include its portfolio of leading local and global beer brands, difficult-to-replicate global and local scale in manufacturing,
and strong distribution capabilities, which contribute to leading regional market share. On a standalone basis, Bud APAC is one of the
largest brewers in the world and over our long-term investment horizon, we believe it is among the best-positioned companies in the
entire value chain. A Fund holding since inception, over the past year, Bud APAC demonstrated continued recovery from the impact
of the pandemic on alcohol consumption in on-premise consumption channels – particularly in its largest country, China. However,
the market reacted negatively to the company ’s performance in South Korea, its second largest country, which accounts for
approximately 20% of its EBITDA (earnings before interest, taxes, depreciation and amortization), and where it is the leader in a
duopoly structure. The South Korea beer industry is facing material near-term headwinds as consumer spending has softened. This has
resulted in industry growth slowing to what we believe is below the long-term structural growth rate. Coupled with high cost inflation,
which the company is slowly recovering through both pricing and premiumization, Bud APAC has also experienced a decrease in
profit margins. Over the long-term, we believe the beer industry will benefit from str uctural drivers that include growth in per capita
consumption and premiumization. Today, premium beer represents only 25% of total volume in South Korea. We believe premium
beer can approach 40% as in other developed markets and that margins will improve as the company continues to recoup inflation
costs through price increases. We believe the secular growth opportunity for Bud APAC is long-term growth in Asia-Pacific emerging
market spending on beer, in particular, China and India. Today, the Asia-Pacific beer markets in which Bud APAC is primarily
focused, namely China, South Korea and India, represent an estimated $120 billion in annual retail spending, which has grown at a
mid-single-digit percentage over the past decade. As a function of its numerous competitive advantages, over our long-term
investment horizon, we believe the company can generate mid-single-digit growth in revenue, driven by mid-to-high single-digit
L
OO
MISSAYLES INTERNATI
O
NAL GR
O
WTH FUND
3
|
growth in China and India, and low single-digit growth in South Korea. With respect to profitability, we believe Bud APAC will
benefit in all of its markets from premiumization, which improves the gross margin, greater efficiency within its sales and marketing
expenditures, which are high when compared with AB InBev’s other regions, and operating leverage. Combining these drivers, we
believe operating margins will expand and operating profits will thereby grow faster than revenue. In addition, as revenue growth
outpaces stable capital expenditures and working capital efficiency further improves, we expect free cash flow will grow faster than
revenues and profits. Over our investment time horizon, we believe free cash flow will grow at a mid-to-high single-digit compounded
annual rate. We believe the share price embeds expectations that underestimate the long-term secular growth drivers and the
company’s superior competitive position. As a result, we believe the shares are selling at a significant discount to our estimate of
intrinsic value, representing a compelling reward-to-risk opportunity.
Doximity is a leading cloud-based platform specifically built for US medical professionals (“MPs”). The company was founded in 2010
and has grown to over 2 million members, including approximately 800,000 physicians representing every medical specialty. Doximit y
provides a single place for MPs to access productivity tools that enable collaboration with colleagues, secure coordination of patient
care, virtual patient visits, customized medical news and research, and career management. Doximity is free to healthcare providers and
monetizes its platform primarily by providing targeted marketing access to customers that are largely pharmaceutical manufacturers
and healthcare systems, which accounted for over 90% of revenue in its most recent fiscal year. A portfolio holding since the first
quarter of 2022, shares responded negatively to the company’s fiscal first quarter financial report in August. The company reported
quarterly financial results that were fundamentally solid and in line with consensus expectations. However, management significantly
lowered its full-year revenue guidance, implying 10% year-over-year growth versus a previous estimate of 20%. Doximity typically
enters its fiscal year with approximately 60%-65% of subscription-based revenue already under contract, with a further 30%-35%
generated through renewing and upselling existing customers – typically in the summer months. In 2023, the company experienced
substantially lower upsell rates, which it attributed to slowing industry spending and the company ’s “white-glove” approach to client
sales that is more time-intensive than the programmatic banner advertising that captured share during the summer. We believe
Doximity’s strong and sustainable competitive advantages include the power of its network, its “physicians first” focus, and its trusted
reputation and brand. The company has firmly established itself as the de facto digital network for healthcare professionals, including
over 80% of US physicians (up from 25% in 2013) and over 90% of graduating US medical students. Members average over 50
connections with Doximity colleagues, which drives utility through referrals, care coordination, knowledge exchange, and career
management. A powerful network effect occurs as the number and engagement of members has increased; Doximity has more data to
create engaging and useful products that are specifically tailored to physician workflows, which in turn drives higher membership and
greater stickiness among users. Shares partially rebounded following the most recent earnings release in November 2023, which
exceeded management’s guidance for revenue and operating profit, leading the company to modestly raise its full-year outlook. The
company also reported that active workflow users reached record levels, as did the number of quarterly, monthly, weekly, and daily
active users – suggesting continued strong levels of engagement among its physician user base. Notably, daily users grew the most,
underscoring the integral role Doximity now plays in day-to-day patient care. Further, net revenue retention among the company’s 20
largest customers was 119%, versus 114% overall – indicating that its most sophisticated and engaged clients continue to be the
company ’s fastest growing customer cohort. We belie ve Doximity’s primary growth driver is the secular shift from traditional
marketing channels to digital c hannels, specificall y in healthcare, where digital spending has lagged due in part to a historic reliance on
pharmaceutical sales representatives. Today, market intelligence firm IDC estimates less than 30% of healthcare advertising spending is
via digital channels, versus 46% on an industry-wide basis and greater than 80% in industries such as computing, appliances, and media
and entertainment. Given the superior return on investment (ROI) for digital advertising as opposed to traditional adver tising, coupled
with growing restrictions on the ability to gain access to key healthcare decision makers through traditional, in-person methods, we
estimate that digital marketing expenditures will grow substantially over our long-term investment horizon to approach 50% of total
healthcare advertising spending. As a physicians-first company, Doximity has historically allocated approximately 90% of its R&D
(research and development) spending towards physician-facing products. The company intends to allocate a higher level of R&D
spending to build c lient-facing technologies that enable advertising clients to more-seamlessl y direct incremental advertising dollars
akin to other successful ad platforms and which likely benefited less-advantaged banner advertising during the quarter. The company is
currently beta testing a new self-service client portal that it expects to be ready in advance of the 2024 upsell season. With its
commanding penetration among healthcare decision makers and superior ROIs for advertisers, we believe Doximity can grow its
capture of the digital opportunity from approximately 5% today to exceed 25%. Over our long-term investment horizon, we believe the
company c an generate approximately 20% compounded annual growth in overall revenues. As the company further penetrates its
existing market and gains scale, we believe it will benefit from operating leverage, and that operating profits and free cash flow will
grow faster than revenue. We believe Doximity’s share price embeds expectations for key revenue and cash flow growth drivers that are
well below our long-term assumptions. As a result, we believe the company is selling at a significant discount to our estimate of its
intrinsic value and offers a compelling reward-to-risk oppor tunity. We added to our holdings in the company during the year.
All aspects of our quality-growth-valuation investment thesis must be present simultaneously for us to make an investment. Often our
research is completed well in advance of the opportunity to invest. We are patient investors and maintain coverage of high-quality
L
OO
MISSAYLES INTERNATI
O
NAL GR
O
WTH FUND
|
4
businesses in order to take advantage of meaningful price dislocations if and when they occur. During the period we initiated a new
position in Arm Holdings plc. We added to our existing holdings in Adyen, Block, and Doximity. We trimmed our existing positions
in Novartis and WiseTech Global.
Outlook
Our investment process is characterized by bottom-up fundamental research and a long-term investment time horizon. The nature of
the process leads to a lower-turnover portfolio in which sector positioning is the result of stock selection. The Fund ended the year
with overweight positions in the consumer discretionary, consumer staples, healthcare, information technology, and communication
services sectors and was underweight in the financials and industrials sectors. We had no exposure to stoc ks in the materials, energy,
utilities, or real estate sectors. From a geographic standpoint we were overweight in emerging markets and Europe and underweight in
developed Asia and North America.
TopTen Holdings as of December 31, 2023
Security Name
% of
Net Assets
The portfolio is actively managed and holdings are subject to change. There is no guarantee the Fund continues to invest in the securities referenced. The holdings listed
exclude any temporary cash investments, are presented on an individual security basis and do not represent holdings of the issuer.
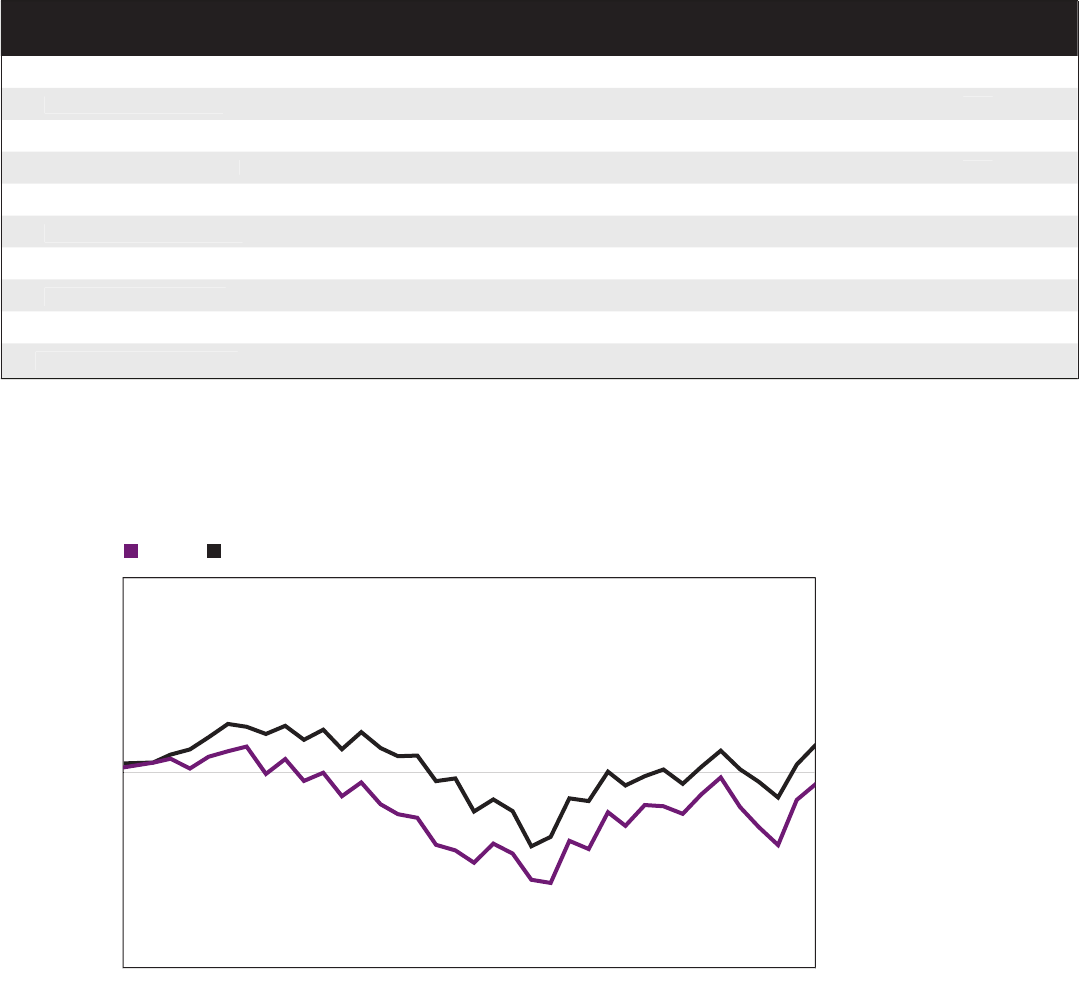
Hypothetical Growth of $100,000 Investment in ClassY Shares
1
December 15, 2020 (inception) through December 31, 2023
$50,000
$100,000
$150,000
12/15/20 12/21 12/22 12/23
$97,169
$107,218
NAV MSCI ACWI ex USA Index (Net)
2
LOOMISSAYLES INTERNATIONAL GROWTH FUN
D
5
|
1 Novo Nordisk AS, Class B 6.88%
2 MercadoLibre, Inc. 6.70
3 Adyen NV 5.62
4 WiseTech Global Ltd. 4.39
5 Tesla, Inc. 3.82
6 Tencent Holdings Ltd. 3.70
7 Ambev SA 3.52
8 Trip.com Group Ltd. 3.50
9 SAP SE 3.46
10 Shopify, Inc., Class A 3.39

Average AnnualTotal Returns —December 31, 2023
1
1 Year Life of Fund
Expense Ratios
3
Gross Net
Class Y (Inception 12/15/20)
NAV
20.81% -0.93% 1.80% 0.95%
Class A
(
Inception 12/15/20
)
NAV
20.56 -1.17 2.05 1.20
With 5.75
%
Maximum Sales Charg
e
13
.
60
-
3
.
08
Class C
(
Inception 12/15/20
)
NAV
19.56 -1.93 2.79 1.95
With CDSC
4
18
.5
6
-1.
93
Class N
(
Inception 12/15/20
)
NAV
20.99 -0.85 1.67 0.90
Comparative Performanc
e
MSCI ACWI ex USA Index (Net
)
2
15.622.
31
Performance data shown represents past performance and is no guarantee of, and not necessarily indicative of, future results. Total return and
value will vary, and you may have a gain or loss when shares are sold. Current performance may be lower or higher than quoted. For most recent
month-end performance, visit im.natixis.com/performance. Performance for other share classes will be greater or less than shown based on
differences in fees and sales charges. You may not invest directly in an index. Performance for periods less than one year is cumulative, not
annualized. Returns reflect changes in share price and reinvestment of dividends and capital gains, if any. The table(s) do not reflect taxes
shareholders might owe on any fund distributions or when they redeem their shares.
1 Fund performance has been increased by fee waivers and/or expense reimbursements, if any, without which performance would have been lower.
2 The MSCI ACWI ex USA Index captures large and mid cap representation across 22 of 23 Developed Markets (DM) countries (excluding the US) and 24 Emerging
Markets (EM) countries. With 2,311 constituents, the index covers approximately 85% of the global equity opportunity set outside the US.
3 Expense ratios are as shown in the Fund’s prospectus in effect as of the date of this report. The expense ratios for the current reporting period can be found in the
Financial Highlights section of this report under Ratios to Average Net Assets. Net expenses reflect contractual expense limitations set to expire on 4/30/24. When a
Fund’s expenses are below the limitation, gross and net expense ratios will be the same. See Note 5 of the Notes to Financial Statements for more information about
the Fund’s expense limitations.
4 Performance for Class C shares assumes a 1.00% contingent deferred sales charge (“CDSC”) applied when you sell shares within one year of purchase.
L
OO
MIS SAYLES INTERNATI
O
NAL GR
O
WTH FUND
|
6

Managers
Robert F. Bierig
Michael J. Mangan, CFA®
Michael A. Nicolas, CFA®
William C. Nygren, CFA®
Harris Associates L.P.
Symbols
Class A NEFOX
Class C NECOX
Class N NOANX
Class Y NEOYX
Investment Goal
The Fund seeks long-term c apital appreciation.
Market Conditions
U.S. equity markets showed strength in 2023 following a challenging 2022, aided by better-than-expected economic data. The calendar
year included heightened volatility, highlighted by turmoil in the banking sector in March and pressure in October when Hamas, an
Islamist political and military organization, orchestrated an attack against Israel, shaking the geopolitical landscape and markets. The
U.S. 10-Year yield rose as high as 5% before declining and ending the period around 3.86% as investors continued to digest economic
data and expectations on interest rates. In the fourth quarter, the U.S. reported its strongest gross domestic product growth in nearly
two years at 4.3% annualized.
Markets were shaken in March as worry about the health of the banking system spread, ignited by the collapse of Silicon Valley Bank
and Signature Bank and furthered by UBS’s purchase of Credit Suisse at a discounted valuation. Major banking institutions and
government agencies around the globe stepped in to help assure depositors their money was saf e, which helped avoid contagion across
the system. Central banks throughout the world continued to tighten monetary policy to combat elevated inflation. The U.S. Federal
Reserve increased its benchmark interest rate by a total of 100 basis points to reach 5.50%. Inflation in the U.S. decelerated throughout
the year, and the Federal Reserve paused its interest rate increases toward the end of the year while assessing economic data.
Performance Results
For the 12 months ended December 31, 2023, Class Y shares of the Natixis Oakmark Fund returned 31.28% at net asset value. The
Fund outperformed its benchmark, the S&P 500
®
Index, which returned 26.29%.
Explanation of Fund Performance
On an absolute-return basis, the financials sector contributed the most to the return of the Fund, while consumer staples was the
largest detractor to total performance.
Meta was a top contributor for the year. The underlying health of the U.S. social media company’s platforms remained strong, in our
view, as daily active users reached new all-time highs. CEO Mark Zuckerberg said since the launch of Reels, time spent on Instagram
has increased 24% and monetization is improving rapidly. Furthermore, the company ’s technical enhancements around targeting seem
to be gaining steam with advertisers, and management remains bullish on the continued growth of messaging across their platforms.
We appreciate Meta’s keen focus on operating efficiency and believe its major investments in AI infrastructure over the past couple
years have positioned it well.
KKR was also a top contributor for the year. In August, the New York-headquartered investment company reported second-quarter
results that were modestly ahead of consensus estimates, largely due to increased transactional activity as capital markets activity
accelerated. Management has highlighted that more than 30 strategies will come to market in the next 12 to 18 months and noted this
number is likely to increase during the third quarter. Separately, KKR launched its retail-oriented private equity and infrastructure
funds mid-year. Management said initial fundraising performance was ahead of expectations and it remains bullish on the 5- to 10-
year opportunity in this largely untapped market, citing KKR’s brand, track record, and significantly expanded marketing and
distribution teams. Finally, in November, KKR announced its acquisition of the remaining 37% of Global Atlantic (GA) for
$2.7 billion. GA has a strong retail distribution network for its annuity business, which KKR can leverage as it continues to establish
its own retail funds.
APA Corp. was a top detractor for the year. Despite reporting solid business fundamentals, the oil and natural gas explorer traded
lower alongside increased volatility in commodity markets. We continue to believe APA has a long runway of underappreciated
inventory in the form of untapped energy assets in the ground, which results in less capital required to replace assets and grow the
NATIXIS OAKMARK FUND
7
|

business over time. We also appreciate that at our estimate of normalized oil prices, APA generates a double-digit free cash flow yield,
and management is returning cash to shareholders via sustainable buybacks and dividends.
Liberty Broadband was also a top detractor for the year des pite reporting solid results. The U.S. communication services company
owns GCI, the primary cable provider in Alaska, and has a notable stake in Charter Communications. We believe Liberty Broadband
is trading at a material discount to its net asset value and that our ownership provides access to Charter Communications at a discount.
Liberty Broadband’s management team is taking advantage of this discount by repurchasing shares. We would not be surprised to see
the price-value gap reduced or eliminated through a transaction with Charter Communications.
Outlook
We believe our intensive research process and focus on the long term help us find oppor tunities despite the pervasive themes of the
time. When the market does not separate the macro from the micro, this creates an exploitable opportunity for long-term investors.
We use times of uncertainty and volatility to strategically position our portfolios for long-term success and believe this approach best
positions us for achieving the protection and appreciation of our investors’ capital over the long term.
TopTen Holdings as of December 31, 2023
The portfolio is actively managed and holdings are subject to change. There is no guarantee the Fund continues to invest in the securities referenced. The holdings listed
exclude any temporary cash investments, are presented on an individual security basis and do not represent holdings of the issuer.
NATIXIS
O
AKMARK FUN
D
|
8
% of
Net AssetsSecurity Name
1 Alphabet, Inc., Class A 3.29%
2 Capital One Financial Corp. 2.83
3 Intercontinental Exchange, Inc. 2.78
4 Wells Fargo & Co. 2.59
5 ConocoPhillips 2.58
6 KKR & Co., Inc. 2.55
7 IQVIA Holdings, Inc. 2.44
8 Comcast Corp., Class A 2.39
9 American International Group, Inc. 2.38
10 Fiserv, Inc. 2.34

Hypothetical Growth of $100,000 Investment in ClassY Shares
1
December 31, 2013 through December 31, 2023
$50,000
$100,000
$150,000
$200,000
$250,000
$300,000
$350,000
$400,000
$450,000
12/13 12/14 12/15 12/16 12/17 12/18 12/19 12/20 12/21 12/22 12/23
$293,273
$311,493
NAV S&P 500
®
Index
2
NATIXISOAKMARK FUN
D
9
|

Average AnnualTotal Returns —December 31, 2023
1
1 Year 5 Years 10 Years
Life of
Class N
Expense Ratios
3
Gross Net
C
lass Y
NAV
31.28% 17.15% 11.36% —% 0.85% 0.80%
C
lass
A
NAV
30.96 16.86 11.08 — 1.10 1.05
With 5.75
%
Maximum Sales Charg
e
23
.45 15.4
8
1
0
.4
2
—
Class
C
NAV
29.99 15.98 10.42 — 1.85 1.80
With CDSC
4
28
.
99
15.
98
1
0
.4
2
—
Class N
(
Inception 5/1/17
)
NAV
31.35 17.25 — 12.83 0.93 0.75
Comparative Performanc
e
S&
P 500® Inde
x
2
26.29 15.69 12.03 12.
88
Performance data shown represents past performance and is no guarantee of, and not necessarily indicative of, future results. Total return and
value will vary, and you may have a gain or loss when shares are sold. Current performance may be lower or higher than quoted. For most recent
month-end performance, visit im.natixis.com/performance. Performance for other share classes will be greater or less than shown based on
differences in fees and sales charges. You may not invest directly in an index. Performance for periods less than one year is cumulative, not
annualized. Returns reflect changes in share price and reinvestment of dividends and capital gains, if any. The table(s) do not reflect taxes
shareholders might owe on any fund distributions or when they redeem their shares.
1 Fund performance has been increased by fee waivers and/or expense reimbursements, if any, without which performance would have been lower.
2 S&P 500® Index is a widely recognized measure of U.S. stock market performance. It is an unmanaged index of 500 common stocks chosen for market size, liquidity,
and industry group representation, among other factors. It also measures the performance of the large cap segment of the U.S. equities market.
3 Expense ratios are as shown in the Fund’s prospectus in effect as of the date of this report. The expense ratios for the current reporting period can be found in the
Financial Highlights section of this report under Ratios to Average Net Assets. Net expenses reflect contractual expense limitations set to expire on 4/30/24. When a
Fund’s expenses are below the limitation, gross and net expense ratios will be the same. See Note 5 of the Notes to Financial Statements for more information about
the Fund’s expense limitations.
4 Performance for Class C shares assumes a 1.00% contingent deferred sales charge (“CDSC”) applied when you sell shares within one year of purchase, and includes
automatic conversion to Class A shares after eight years.
NATIXIS
O
AKMARK FUN
D
|
1
0

Managers
David G. Herro, CFA®
Eric Liu, CFA®*
Michael L. Manelli, CFA®
Harris Associates L.P.
Symbols
Class A NOIAX
Class C NOICX
Class N NIONX
Class Y NOIYX
* Effective August 31, 2023, Eric Liu serves as portfolio manager of the Fund.
Investment Goal
The Fund seeks long-term c apital appreciation.
Market Conditions
Major global markets generally showed strength in 2023 following a challenging 2022. The calendar year included heightened
volatility, highlighted by turmoil in the banking sector in March and pressure in October when Hamas, an Islamist political and
military organization, orchestrated an attack against Israel, shaking the geopolitical landscape and markets. While the U.S. and
European equity markets showed strength on the back of better-than-expected economic data, Asian markets were mixed with
Chinese equities experiencing pressure and Japanese equities reaching 30-year highs during the per iod. The U.S.10-Year yield rose as
high as 5% before declining and ending the period around 4% as investors continued to digest economic data and expectations on
interest rates.
Central banks throughout the world continued to tighten monetary policy to combat elevated inflation. The U.S. Federal Reserve
increased its benchmark interest rate by a total of 100 basis points to reach 5.50%, the European Central Bank opted for 200 basis
points to reach 4.50%, and the Bank of England chose 175 basis points to reach 5.25%. Inflation in the U.S. and eurozone decelerated
throughout the year, with most central banks pausing their interest rate increases toward the end of the year while assessing economic
data. The Bank of Japan continued its accommodative monetary policy stance although it took a step toward reversing the policy when
it announced that the 1% cap on its 10-year government bonds would be considered a reference rate going forward. In the fourth
quarter, the yen reversed its trend and gained value, ending the period at approximately 141 USD/JPY.
Performance Results
For the 12 months ended December 31, 2023, Class Y shares of the Natixis Oakmark International Fund returned 19.26% at net asset
value. The Fund outperformed its benchmark, the MSCI World ex USA Index (Net), which returned 17.94%.
Explanation of Fund Performance
The industrials sector contributed most to the Fund’s return and no sectors impacted Fund performance negatively.
Ryanair was a top contributor for the year. The Irish airline benefitted from strong travel demand within Europe as well as a pickup in
foreign visitors to the region. During our mid-year conversations with management, CEO Michael O’Leary was optimistic about
Ryanair’s future due to increased bookings industry-wide, expectations for higher oil prices and elevated cost structures of peers driving
higher pricing. We appreciate that Ryanair continues to reduce unit costs and widen the gap between itself and more capacity-
constrained European competitors. In the fourth quar ter, Ryanair reported additional revenue growth and strong free cash flow levels,
which allowed the company to reinstate a EUR 400 million dividend and announce an incremental EUR 1.5 billion return to
shareholders starting in 2025.
Intesa Sanpaolo, the largest bank in Italy, was a top contributor for the year. Intesa has generated substantial net profit increases in
recent periods thanks to a significant rise in net interest income. This was consistent with our view that Intesa would dramatically
benefit from rising rates. In addition, Intesa’s non-performing loan formation has continued to decline, reflecting its low-risk business
model and strong underwr iting practices. Management has also been able to keep operating costs well-controlled thanks to efficiency
measures that have largely offset inflationary impacts. With one of the highest dividend payout ratios in Europe, Intesa has been
returning capital to shareholders via buybacks while maintaining a robust balance sheet.
Worldline was a top detractor for the year. In October, the French multinational payment and transactional services company delivered
a weaker than expected set of results and the stock fell significantly on the news. Management reduced growth estimates citing two
factors: (1) a negative mix shift in Germany as German consumers shifted from discretionary to non-discretionary purchases and
(2) merchant terminations, driven by Worldline voluntarily and proactively cutting ties with certain online merchants at risk of
NATIXIS OAKMARK INTERNATIONAL FUND
11
|

violating new regulatory standards. We spoke with management after the results and confirmed both factors are transitory. We
continue to believe the payments industry is a structurall y attractive GDP+ growth market, and Worldline, as the European payments
leader, has a very long growth runway given lower European cashless penetration and higher levels of bank payment in-sourcing versus
the U.S.
Bayer was also a top detractor for the year. In November, shares of the German health care company fell after it announced negative
news on two known unknowns: (1) Bayer stopped its phase I II OCEANIC-AF trial for anti-clotting drug asundexian earl y due to
lack of efficacy and (2) the company received an adverse RoundUp verdict for $1.5 billion over three plaintiffs. We spoke with CEO
Bill Anderson after the announcement and he articulated a very strategic, thoughtful framework for managing the situation. Although
we reduced our estimate of intrinsic value, we continue to view Bayer’s position across the crop sciences ecosystem as unrivaled and
believe the company can take por tfolio actions to unloc k value.
Outlook
We believe our intensive research process and focus on the long term help us find opportunities despite the pervasive themes of the
time. When the market does not separate the macro from the micro, this creates an exploitable opportunity for long-term investors.
We use times of uncertainty and volatility to strategically position our portfolios for long-term success and believe this approach best
positions us for achieving the protection and appreciation of our investors’ capital over the long term.
TopTen Holdings as of December 31, 2023
The portfolio is actively managed and holdings are subject to change. There is no guarantee the Fund continues to invest in the securities referenced. The holdings listed
exclude any temporary cash investments, are presented on an individual security basis and do not represent holdings of the issuer.
Security Name
% of
Net Assets
1 CNH Industrial NV 3.59%
2 Lloyds Banking Group PLC 3.52
3 BNP Paribas SA 3.11
4 Mercedes-Benz Group AG 2.71
5 Bayer AG 2.57
6 Kering SA 2.56
7 Prudential PLC 2.53
8 Continental AG 2.52
9 Fresenius Medical Care AG 2.45
10 Intesa Sanpaolo SpA 2.37
NATIXIS OAKMARK INTERNATIONAL FUN
D
|
12


Average AnnualTotal Returns —December 31, 2023
1
1 Year 5 Years 10 Years
Life of
Class N
Expense Ratios
4
Gross Net
C
lass Y (Inception 5/1/17)
NAV
2
V
V
19.26% 7.33% 3.07% —% 1.13% 0.90%
C
lass
A
NAV
18.94 7.07 2.90 — 1.38 1.15
With 5.75
%
Maximum Sales Charg
e
12
.14 5.
8
1
2
.
29
—
Class
C
NAV
18.01 6.28 2.28 — 2.13 1.90
With CDSC
5
1
7.
0
1
6
.
28 2
.
28
—
Class N
(
Inception 5/1/17
)
NAV
19.30 7.40 — 3.13 1.02 0.85
Comparative Performanc
e
MSCI World ex USA Index (Net)
3
17.94 8.45 4.32 5.
86
Performance data shown represents past performance and is no guarantee of, and not necessarily indicative of, future results. Total return and
value will vary, and you may have a gain or loss when shares are sold. Current performance may be lower or higher than quoted. For most recent
month-end performance, visit im.natixis.com/performance. Performance for other share classes will be greater or less than shown based on
differences in fees and sales charges. You may not invest directly in an index. Performance for periods less than one year is cumulative, not
annualized. Returns reflect changes in share price and reinvestment of dividends and capital gains, if any. The table(s) do not reflect taxes
shareholders might owe on any fund distributions or when they redeem their shares.
1 Fund performance has been increased by fee waivers and/or expense reimbursements, if any, without which performance would have been lower.
2 Prior to the inception of Class Y shares (5/1/2017), performance is that of Class A shares and reflects the higher net expenses of that share class.
3 MSCI World ex USA Index (Net) is an unmanaged index that is designed to measure the equity market performance of developed markets, excluding the
United States.
4 Expense ratios are as shown in the Fund’s prospectus in effect as of the date of this report. The expense ratios for the current reporting period can be found in the
Financial Highlights section of this report under Ratios to Average Net Assets. Net expenses reflect contractual expense limitations set to expire on 4/30/24. When a
Fund’s expenses are below the limitation, gross and net expense ratios will be the same. See Note 5 of the Notes to Financial Statements for more information about
the Fund’s expense limitations.
5 Performance for Class C shares assumes a 1.00% contingent deferred sales charge (“CDSC”) applied when you sell shares within one year of purchase, and includes
automatic conversion to Class A shares after eight years.
NATIXIS
O
AKMARK INTERNATI
O
NAL FUN
D
|
14

Managers
Robert F. Bierig
Michael J. Mangan, CFA®, CPA
Michael A. Nicolas, CFA®
William C. Nygren, CFA®
Harris Associates L.P.
Aziz V. Hamzaogullari, CFA®
Loomis, Sayles & Company, L.P.
Symbols
Class A NEFSX
Class C NECCX
Class N NESNX
Class Y NESYX
Investment Goal
The Fund seeks long-term growth of capital.
Market Conditions
The Natixis U.S. Equity Opportunities Fund is composed of two separate segments, combining the value expertise of Harris
Associates with the growth expertise of Loomis Sayles. The two segments have common investment philosophies and a rigorous long-
term, bottom-up research process f ocused on high-quality businesses trading at a significant discount to intrinsic value.
Despite the economic pessimism that prevailed at the beginning of 2023, the economy continued to turn in strong results while the
S&P 500® posted a 26.4% return including dividends. This c ame in the wake of 2022, when the U.S. Federal Reserve (Fed) began an
aggressive campaign to raise interest rates, the S&P 500® posted a 19.44% loss, and many economists predicted a recession. By the end
of 2023, after seven Fed rate increases, inflation as measured by the Consumer Price Index fell by more than half from 6.4% in January
to 3.1%. Late in the year, the Fed announced an end to its series of rate increases and is expected to cut rates three times in 2024 as
inflation continues to moderate.
Despite declining inflation during 2023, mortgage rates remained high by recent standards, hitting a 20-year high of 8% in October.
When the Fed reported that the rate hiking cycle had ended, mortgage rates began to fall, settling below 7% in December. Despite this
fact, mortgage rates are still twice as high as they were in January 2021. Housing prices continued to increase, with median home
prices rising above $400,000 in the third quarter as inventory fell to new lows, making it difficult for new buyers to enter the market.
With many employees on hybrid schedules, commercial real estate took a beating that is expected to continue into 2024. This sector
lost $590 billion in value in 2023 and is expected to hemorrhage a further $480 billion in 2024.
Contributing to the Fed’s anticipated rate cuts in 2024 were moderating job gains. While unemployment rates stayed low—below
4%—for all of 2023, job growth cooled.Wages rose robustly at 0.8% annually through November for all wages and 1.1% for non-
supervisory and production workers, who make up 80% of the workforce. Consumers continued to prop up the economy in 2023,
spending more than expected, even as savings from the Covid-19 pandemic dwindled.
On the technology front, generative artificial intelligence (AI) took the economy and markets by storm. Worldwide generative AI
spending neared $20 billion in 2023, as organizations sought to monetize this productivity-enhancing technology. The seven largest
technology stocks by market capitalization led the market in 2023, contributing nearl y half the overall stock market gain. Overall,
technology stocks turned in their best performance since 2009, rallying by 59.1%. The tech-heavy Nasdaq rose by 43%. Small-cap
stocks, as captured by the Russell 2000® Index, notched a 15.1% gain, as the Dow Jones Industrial Average rose by 13%.
The bond market bounced back in 2023 following its worst year on record in 2022. The 10-Year Treasury Bond yield ended 2023 at
3.84%, while the 2-Year Treasury Bill yield was 4.26%. The effective Federal Funds rate was 5.33%. The Morningstar U.S. Core Bond
index rose by 5.32%, buoyed by a strong fourth quarter. Savers benefitted from higher rates, as rates on CDs, high-yield savings and
newly issued bonds increased.With Fed rate cuts on the horizon in 2024, these rates are expected to decline, although they are likely
to remain higher than in the recent past.
NATIXIS U.S. EQUITY OPPORTUNITIES FUND
15
|
While the economy continued to hum along, turbulence continued on the geopolitical front as war broke out between Israel and
Hamas and the conflict between Russia and Ukraine dragged into the second year. Despite these conflicts, gas prices f ell during 2023,
contributing to the overall decline in inflation. Global stock markets overall tracked U.S. markets, with the MSCI Global Index
notching a 22% gain in 2023.
Performance Results
For the 12 months ended December 31, 2023, Class Y shares of the Natixis U.S. Equity Opportunities Fund returned 37.35% at net
asset value. The Fund outperformed its primary benchmark, the S&P 500
®
Index, which returned 26.29%, and also outperformed its
secondary benchmark, the Russell 1000
®
Index, which returned 26.53%.
Explanation of Fund Performance
Each of the portfolio’s segments uses a distinct investment sty le, providing shareholders with exposure to a variety of different stocks:
• T
he Harris Associates Large Cap Value segment invests primarily in the common stocks of larger-capitalization companies that
Harris Associates L.P. (“Harris Associates”) believes are trading at a substantial discount to the company’s “true business value.”
• The Loomis Sayles All Cap Growth segment invests primarily in equity securities and may invest in companies of any size. The
segment employs a growth style of equity management that emphasizes companies with sustainable competitive advantages versus
others, long-term structural growth drivers that will lead to above-average future cash flow growth, attractive cash flow returns on
invested capital, and management teams focused on creating long-term value for shareholders. The segment aims to invest in
companies when they trade at a significant discount to the estimate of intrinsic value.
Both segments contributed positively to the Fund’s performance.
Harris Associates Large Cap Value Segment
On an absolute-return basis, the financials sector contributed the most to the return of the segment, while the consumer staples sector
was the only sector with a negative contribution to the total return.
Meta was a top contributor for the year. The underlying health of the U.S. social media company’s platforms remained strong, in our
view, as daily active users reached new all-time highs. CEO Mark Zuckerberg said since the launch of Reels, time spent on Instagram
has increased 24% and monetization is improving rapidly. Furthermore, the company ’s technical enhancements around targeting seem
to be gaining steam with advertisers, and management remains bullish on the continued growth of messaging across their platforms.
We appreciate Meta’s keen focus on operating efficiency and believe its major investments in AI infrastructure over the past couple
years have positioned it well.
KKR was also a top contributor for the year. In August, the New York-headquartered investment company reported second-quarter
results that were modestly ahead of consensus estimates, largely due to increased transactional activity as capital markets activity
accelerated. Management has highlighted that more than 30 strategies will come to market in the next 12 to 18 months and noted this
number is likely to increase during the third quarter. Separately, KKR launched its retail-oriented private equity and infrastructure
funds mid-year. Management said initial fundraising performance was ahead of expectations and it remains bullish on the 5- to 10-
year opportunity in this largely untapped market, citing KKR’s brand, track record, and significantly expanded marketing and
distribution teams. Finally, in November, KKR announced its acquisition of the remaining 37% of Global Atlantic (GA) for
$2.7 billion. GA has a strong retail distr ibution network for its annuity business, which KKR can leverage as it continues to establish
its own retail funds.
APA Corp. was a top detractor for the year. Despite reporting solid business fundamentals, the oil and natural gas explorer traded
lower alongside increased volatility in commodity markets. We continue to believe APA has a long runway of underappreciated
inventory in the f orm of untapped energy assets in the ground, which results in less capital required to replace assets and grow the
business over time. We also appreciate that at our estimate of normalized oil prices, APA generates a double-digit free cash flow yield,
and management is returning cash to shareholders via sustainable buybacks and dividends.
General Motors (GM) was also a top detractor for the year. In April, the U.S. auto company reported a drop in profits and the
discontinuation of its top-selling electric vehicle, the Chevrolet Volt. In August, shares fell again on news that production of GM’s
electric vehicle lineup was being slowed by issues in assembling updated battery modules. Finally, members of the United Auto
Workers union (UAW ) went on strike following the expiration of its labor contract in September. The strike targeted the GM
NATIXIS U.S. EQUITY
O
PP
O
RTUNITIES FUN
D
|
1
6
Wentzville assembly plant, which accounts for around 7% of the company’s North American production. UAW was able to reach a
deal with GM in mid-November, ending the six-week labor disruption.
Loomis Sayles All Cap Growth Segment
We are an active manager with a long-term, private equity approach to investing. Through our proprietary bottom-up research
framework, we look to invest in those few high-quality businesses with sustainable competitive advantages and profitable growth when
they trade at a significant discount to intrinsic value. For the period, the All Cap Growth segment posted a positive absolute return.
Our holdings in each of the information technology, communication services, consumer discretionary, industrials, financials, consumer
staples, and healthcare sectors contributed positively to the segment’s perf ormance.
Nvidia and Meta Platf orms were the largest contributors to performance during the period. Nvidia is the world leader in artificial
intelligence (AI) computing, which enables computers to mimic human-like intelligence for problem solving and decision-making
capabilities. We believe the company ’s competitive advantages include its intellectual property, brands, and a large and growing
ecosystem of developers and applications utilizing its GPU (graphic processing unit) technology. A portfolio holding since January
2019, after shares were under pressure throughout most of 2022 given a weak market backdrop, shares rebounded substantially over the
past 12 months, with gains accelerating following the company ’s first quarter earnings report in May. Nvidia reported record financial
results that were well above consensus expectations, as AI applications, including generative AI, are dr iving strong demand for GPUs
by companies looking to leverage these capabilities and drive competitive differentiation. The company also provided revenue guidance
that was substantially higher than consensus expectations, resulting in a material increase in expectations for revenue, profits, and free
cash flow for its full fiscal year. Revenue in the company ’s gaming segment had been depressed, which we believe reflected global
demand for PCs returning to pre-pandemic levels after a period of excess and the impact of Covid restrictions on China consumer
spending. However, we believe the company has worked expeditiousl y in clearing existing inventory in its retail channels, which
contributed to the gaming business returning to growth in the past two quarters. In the company ’s data center business, we believe the
company ’s decades of focused investment, cumulative know-how, and robust software platform and architecture that has attracted
millions of developers, position the company to benefit from several secular long-term growth drivers, including continued growth in
use cases for artificial intelligence. To further drive adoption by enterprises, Nvidia is also partnering with cloud service providers
including Oracle, Microsoft, and Google to offer AI services via the cloud. We believe Nvidia remains strongly positioned to benefit
from secular growth in PC gaming and is still in the earl y stages of growth in its data center business, which has the potential to be
much larger. We believe Nvidia’s strong growth prospects are not currently reflected in its share price. As a result, we believe the
company ’s shares are trading at a significant discount to our estimate of intrinsic value, offering a compelling reward-to-risk
opportunity. We trimmed our position on multiple occasions during the year as the company reached our maximum allowable position
size of eight percent due to market appreciation.
Meta Platforms operates online social networking platforms that allow people to connect, share, and interact with friends and
communities. With 3.9 billion monthly users, 200 million businesses, and 10 million advertisers worldwide using its family of apps –
Facebook, Messenger, WhatsApp, and Instagram – we believe the sc ale and reach of Meta’s network is unrivaled. A strategy holding
since its initial public offering in 2012, Meta’s shares rebounded substantially in 2023 after being under pressure throughout most of
2022 due to a perceived lack of discipline in the company ’s capital expenditures – especially with respect to the metaverse – that
coincided with what we believed was temporary fundamental weakness arising from the company ’s transition to a new advertising
format and maneuvering around privacy changes imposed by Apple in 2021. Our analysis suggested that Meta was being priced as if a
high-quality, high-returning, growth company – whose returns on capital were many times larger than its cost of capital – would
become a low-quality business that both ceased to grow and would also see its margins and returns on invested capital deteriorate. We
took advantage of price weakness in 2022 to add to our holdings on multiple occasions during that year, most recently in November
2022. Despite ongoing macroeconomic pressure on advertising spending, Meta has since posted four consecutive quar ters of better-
than-expected financial results, including accelerating revenue growth in the last three quarters as it made further progress in
navigating Apple’s privacy changes and saw improved monetization of its newest Reels video format. Following this period of
temporary weakness and elevated investment spending, Meta announced a set of efficiency measures that have already led to
significant improvements in margins and lower capital expenditure plans, and shares responded positivel y to the company ’s increased
focus on productivity and cost management. We believe founder and CEO Mark Zuckerberg has always managed the company with a
long-term focus and strong strategic vision. Over the past ten years, Meta has spent over $125 billion on research and development
and $110 billion on capital expenditures – a level of investment that few firms can match, and which creates high barriers to entry for
competitors that are further buttressed by the growth of cumulative knowledge over time. The successful development of a metaverse is
not an explicit part of our investment thesis for Meta. However, given the potential size of the opportunity, which we estimate could
impact over $1 trillion of spending over the long term, and Meta’s positioning with billions of users and hundreds of millions of
businesses, we believe Meta’s current balanced approach to its forward-looking investments make sense. We expect that corporations
will continue to allocate an increasing proportion of their advertising spending online, and Meta remains one of very few platforms
where advertisers can reach consumers at such scale in such a targeted and effective fashion. We believe Meta’s brands, network, and
NATIXIS U.S. EQUITY
O
PP
O
RTUNITIES FUN
D
17
|
targeting advantage position the company to take increasing share of the industry’s profit pool and grow its market share from
approximately 6% currently to approximately 10% of the total global advertising market over our investment time horizon. On the
basis of its core business alone, we believe the company is substantially undervalued and trades at a significant discount to our estimate
of intrinsic value. We trimmed our position on multiple occasions during the year because it reached our maximum allowable position
size of eight percent due to market appreciation.
Alnylam Pharmaceuticals and Il lumina were the largest detractors during the period. Alnylam Pharmaceuticals is a leader in gene
therapies based on its pioneering small-interfering RNA (siRNA) approach to disease treatment. Founded in 2002, Alnylam was one
of the first companies to develop and commercialize therapies based on RNA interference (RNAi), a breakthrough discovery in
understanding how genes are naturally regulated within cells that was recognized with the 2006 Nobel Prize in Medicine. RNAi
therapies exploit a naturally occurring biological pathway within cells that regulates the expression of specific genes. In particular,
siRNA has proven to be one of the most effective approaches to RNAi therapy, and Alnylam remains the first and only company to
successfully commercialize siRNA-based therapies. We believe Alnylam’s strong and sustainable competitive advantages include its
deep, cumulative and compounding knowledge in the science of RNAi therapeutics, in particular its creation and advancement of
unique siRNA-based therapies, and the multiple partnerships it has entered on the basis of its technology which provide both external
funding and established commercialization avenues. Currently, the company ’s technology is the basis for five approved therapies, ten
therapies currently in clinical trials, and a robust pipeline of potential treatments that we expect to enter the clinic in the coming years,
with a focus on genetic diseases, cardiometabolic diseases, infectious diseases, and central nervous system and ocular diseases. A
strategy holding since the second quarter of 2021, shares responded negatively to the dimming prospects for patisiran, Alnylam’s
approved therapy for hATTR amyloidosis, to receive regulatory approval in the larger, related indication of ATTR with
cardiomyopathy (ATTR-CM). In October, the company decided to discontinue its bid to attain approval in favor of its more robust
and longer trial for vutr isiran. Vutrisiran is also approved for hATTR amyloidosis, but the therapy is delivered via subcutaneous
injection every three months, while patisiran requires intravenous administration every three weeks. While the outcomes for patisiran
were positive and statisticall y significant, the FDA was likely to require fur ther study, and the easier administration of vutrisiran, which
was developed after patisiran, makes the therapy more commercially attractive. Vutrisiran is currently in Phase III clinical trials for
ATTR-CM, with results expected in the first half of 2024. We believe the uniqueness of Alnylam’s pioneering scientific expertise and
technology is evident from both its existing products, which provide meaningful value to previousl y underserved patient populations, as
well as the numerous partnerships in which world-class global pharmaceutical companies and specialt y competitors alike have sought
to access its proprietary technology. With its approved therapies and substantial pipeline of significant late-stage clinical programs, we
believe the company has now reached the point at which its existing therapies will continue to contribute positively and its subsequent
innovations will shift its financial profile from that of an early-stage biotech company to a profitable business with normalized margins
that is able to internall y fund its ongoing growth needs. Over our long-term investment horizon, we believe the company can generate
substantial revenue growth, while turning profitable and generating substantial cumulative free cash flow. We believe Alnylam’s market
price continues to substantially undervalue the potential contribution from the company’s clinical-stage assets – which we believe is
unsupported by the company ’s established track record for producing genetically validated therapeutics. Further, while embedded
expectations reflect some success for its currently marketed products, we believe the market is focused on short-term profitability while
ignoring the platform the company has built, that we believe will serve as the basis for ongoing innovation o ver our long-term
investment horizon and beyond. As a result, we believe the company is selling at a substantial discount to our estimate of its intrinsic
value and offers a compelling reward to risk opportunity.
Founded in 1998, Illumina is the industry leader in the fast-growing field of sequencing for genetic and genomic analysis, supporting
research, clinical, and consumer genetics applications. A strategy holding since March 2020, Illumina’s shares have been under pressure
due to lower-than-expected results in its core business, uncertainty regarding its acquisition of GRAIL, and near-term management
uncertainty following an activist investor campaign that succeeded in ousting the Chairman of the Board in May and later prompted
the resignation of CEO Francis deSouza in June. While orders for its newest sequencing platform, NovaSeq X, had been solid, they
slowed in the company ’s most recently reported quarter as the company observed a lengthening sales cycle among customers facing
macroeconomic pressure – which has similarly impacted peers as well. Still, the company ’s recent results and guidance are below our
long-term expectations as we believe the GRAIL acquisition has detracted from near-term focus and returns. Illumina acquired
GRAIL in August 2021, but closed the transaction prior to receiving approval from the EU, which has since ordered that the business
be divested. In December 2023, Illumina announced it will divest GRAIL and aims to have the terms finalized by the end of second
quarter 2024. GRAIL is an early leader in asymptomatic cancer screening through liquid biopsies that use Illumina’s sequencing
technology to detect tumor DNA in the bloodstream before it could otherwise be sampled via a traditional biopsy. While we believed
that there was potential upside in GRAIL, our structural investment thesis for Illumina was not premised on a successful completion
of the acquisition, and GRAIL will remain an important customer for the company. We believe the core Illumina business remains
highly attractive on a reward-to-risk basis and remains substantially discounted relative to intrinsic value. Illumina is in the early stages
of a major platform launch while simultaneously facing more competition than in recent years. Over the last two years, Illumina’s share
of industry revenue has dropped from an estimated 80% to 77%. These share losses have been most pronounced in China and in the
NATIXIS U.S. EQUITY
O
PP
O
RTUNITIES FUN
D
|
1
8

lower-value, mid- and low- throughput portions of the sequencing market. We anticipate Illumina will retain its dominant share in the
high-value, high-throughput ends of the market on the strength of its product ecosystem and continue to capture approximately 75%
of the sequencing market. In September, the company named Jacob Thaysen, Ph.D. as its new CEO. Thaysen previously served as
President of the Life Sciences and Applied Markets Group at Agilent, and brings a background in research and development (R&D)
as well as experience operating in genetics and clinical end markets. We met with Thaysen and our interactions have been positive as
we believe he has the requisite skills and vision to reinvigorate the core Illumina franchise. We are encouraged that new management
seems committed to redoubling its focus on the significant opportunity in Illumina’s core markets and reinvigorating operational
execution – which appeared to have diminished over the last several quarters under deSouza. In addition to the activist-sponsored
candidate, Illumina also added two new board members with significant experience at innovative, market-expanding healthcare
businesses that we believe should contribute positively to Illumina’s return to growth. Despite the near-term uncertainty, we believe
Illumina remains advantageously positioned in a high-quality industry benefiting from long-term, secular growth.We believe Illumina
is at the forefront of a multi-decade transformation that will see genetic analysis incorporated into multiple facets of our lives. While
demand today is still predominantly from large life sciences research facilities, over the next decade we believe democratization of gene
sequencing technology and greater practical application will result in the equipment becoming ubiquitous in clinical settings as well,
with oncology offering the largest market opportunity. We belie ve Illumina is a dominant competitor whose sequencing technology
represents the critical enabling technology that ideally positions it to capitalize on an approximately $100 billion market opportunity.
We believe I llumina’s shares embed expectations for key revenue and cash flow growth drivers that are well below our long-term
assumptions. As a result, we believe the company is selling at a significant discount to our estimate of its intrinsic value and offers a
compelling reward-to-risk opportunity. We added to our position on multiple occasions this year, most recently in late September.
TopTen Holdings as of December 31, 2023
Security Name
% of
Net Assets
1 Alphabet, Inc., Class A 4.57%
2 Amazon.com, Inc. 4.06
3 Meta Platforms, Inc., Class A 3.49
4 NVIDIA Corp. 3.39
5 Capital One Financial Corp. 2.87
6 KKR & Co., Inc. 2.77
7 Salesforce, Inc. 2.69
8 Oracle Corp. 2.63
9 Bank of America Corp. 2.52
10 Boeing Co. 2.36
The portfolio is actively managed and holdings are subject to change. There is no guarantee the Fund continues to invest in the securities referenced. The holdings listed
exclude any temporary cash investments, are presented on an individual security basis and do not represent holdings of the issuer.
NATIXIS U.S. EQUITY OPPORTUNITIES FUN
D
1
9
|

Hypothetical Growth of $100,000 Investment in ClassY Shares
1
December 31, 2013 through December 31, 2023
$50,000
$100,000
$150,000
$200,000
$250,000
$300,000
$350,000
$400,000
$450,000
12/13 12/14 12/15 12/16 12/17 12/18 12/19 12/20 12/21 12/22 12/23
$344,706
$311,493
$305,216
NAV S&P 500
®
Index
2
Russell 1000
®
Index
3
See notes to chart on page 21.
NATIXIS U.S. EQUITY OPPORTUNITIES FUN
D
|
20

Average AnnualTotal Returns —December 31, 2023
1
1 Year 5 Years 10 Years
Life of
Class N
Expense Ratios
4
Gross Net
Class Y
NAV
37.35% 16.60% 13.17% —% 0.81% 0.81%
Class
A
NAV
37.01 16.30 12.89 — 1.06 1.06
With 5.75
%
Maximum Sales Charg
e
29
.1
3
14.
9
41
2
.
22
—
Class
C
NAV
35.98 15.43 12.22 — 1.81 1.81
With CDS
C
5
3
4.
98
15.4
3
1
2
.
22
—
Class N
(
Inception 5/1/17
)
NAV
37.44 16.68 — 13.82 1.28 0.75
Comparative Performanc
e
S&
P 500® Inde
x
2
26.29 15.69 12.03 12.
88
Russell 1000
®
Index
3
26
.5
3
15.5
2
11.
80
1
2
.
67
Performance data shown represents past performance and is no guarantee of, and not necessarily indicative of, future results. Total return and
value will vary, and you may have a gain or loss when shares are sold. Current performance may be lower or higher than quoted. For most recent
month-end performance, visit im.natixis.com/performance. Performance for other share classes will be greater or less than shown based on
differences in fees and sales charges. You may not invest directly in an index. Performance for periods less than one year is cumulative, not
annualized. Returns reflect changes in share price and reinvestment of dividends and capital gains, if any. The table(s) do not reflect taxes
shareholders might owe on any fund distributions or when they redeem their shares.
1 Fund performance has been increased by fee waivers and/or expense reimbursements, if any, without which performance would have been lower.
2 S&P 500® Index is a widely recognized measure of U.S. stock market performance. It is an unmanaged index of 500 common stocks chosen for market size, liquidity,
and industry group representation, among other factors. It also measures the performance of the large cap segment of the U.S. equities market.
3 Russell 1000® Index measures the performance of the large-cap segment of the U.S. equity universe. It is a subset of the Russell 3000® Index and includes
approximately 1000 of the largest securities based on a combination of their market cap and current index membership. The Russell 1000® Index represents
approximately 92% of the U.S. market and is constructed to provide a comprehensive and unbiased barometer for the large-cap segment and is completely
reconstituted annually to ensure new and growing equities are reflected.
4 Expense ratios are as shown in the Fund’s prospectus in effect as of the date of this report. The expense ratios for the current reporting period can be found in the
Financial
Highlights section of this report under Ratios to Average Net Assets. Net expenses reflect contractual expense limitations set to expire on 4/30/25. When a
Fund’s expenses are below the limitation, gross and net expense ratios will be the same. See Note 5 of the Notes to Financial Statements for more information about
the Fund’s expense limitations.
5 Performance for Class C shares assumes a 1.00% contingent deferred sales charge (“CDSC”) applied when you sell shares within one year of purchase, and includes
automatic
conversion to Class A shares after eight years.
NATIXIS U.S. EQUITY
O
PP
O
RTUNITIES FUN
D
21
|

Managers
Dennis G. Alff, CFA®
Chad D. Fargason
Chris D. Wallis, CFA®
Vau g han Nelson Investment Management, L.P.
Symbols
Class AVNVAX
Class CVNVCX
Class N VNVNX
Class Y VNVYX
Investment Goal
The Fund seeks long-term c apital appreciation.
Market Conditions
During the fiscal year ending December 31, 2023, the market began with sequential growth slowing in both the first and second
quarters. Typically, banking stress develops once we are well into a recession as the ability for borrowers to service debt becomes
impaired. Given the rapid increase in interest rates, regional banks fell under tremendous pressure.
As we moved through the summer months, global growth continued to deteriorate as the impact of aggressive r ate increases affected
economic fundamentals. In the U.S., the manufacturing and transportation sectors recessed, and the service sector slowed further.
Offsetting the deteriorating economic environment were continued liquidity injections by the major non-U.S. central banks and the
U.S. Federal Reserve’s (Fed) reverse repo facility, which became the primary source of liquidity for rebuilding the U.S. Treasury’s
general account. This flood of liquidity boosted equity markets and dampened fixed income volatility, compressing fixed income
spreads (the difference in yield between bonds with similar maturity but different credit quality).
Inflation peaked in the fourth quarter of 2022 and economic growth bottomed, which set the stage for the move higher in U.S. equity
markets during the first seven months of 2023. The reacceleration in growth coupled with declining inflation allowed the market to
begin pricing in a “soft landing” for the U.S. economy despite aggressive monetary policy tightening, the emergence of a banking crisis,
and rising U.S. Treasury yields as the U.S. Treasury struggled to fund rising deficit spending. The Fed added fuel to the rall y by
aggressively pumping liquidity into the banking system to offset the material losses on bank balance sheets.
During the fourth quarter, improving supply chains, rising employment participation rates, and the lagging influence of stabiliz ed
home prices and rental inflation continued to promote disinflationary conditions. Declining inflationary pressures, combined with
stable economic growth, produced a material improvement in financial conditions as the market discounted future Fed rate cuts
without any corresponding decrease in earnings expectations or economic weakness. The resulting decline in interest rates led to a
powerful fourth quarter rally in equity and fixed income markets.
Performance Results
For the 12 months ended December 31, 2023, Class Y shares of the Vaughan Nelson Mid Cap Fund returned 16.52% at net asset
value. The Fund outperformed its benchmark, the Russell Mid Cap Value® Index, which returned 12.71%.
Explanation of Fund Performance
The Fund outperformed on a relative basis during the period.
Health care was the top performing sector with Cencora, Inc. leading the way. Cencora benefited from both multiple expansion and
positive earnings revisions. The company’s consistent top-line and bottom-line growth combined with strong cash flow generation and
return of capital were rewarded.
Materials outperformed, driven by stock selection. Constellium SE Class A outperformed on a c ycle of positive earnings revisions, as
demand remained robust, and the company spoke to the end of destocking in packaging.
Overweight and selection within information technology aided performance. The strongest name was Motorola Solutions, Inc.
Motorola’s public end markets continued to prove strong and consistent, as the company was able to beat and raise earnings
expectations throughout the year.
Financials outperformed via selection with Comerica Incorporated leading the way. Comerica benefited with the rest of the regional
banks as valuations had gotten too punitive for what may turn out to be a shallow recession.
Consumer staples’ outperformance was led by Church & Dwight Co., Inc. After a year of disappointing investors in 2022, Church &
Dwight regained its credibility in 2023 by putting an end to the downward revision cycle, while recent acquisitions performed better
VAUGHAN NELSON MID CAP FUND
|
22

than expectations. Additionally, with GLP1 headlines hurting packaged food and beverage stocks, Church & Dwight benefited on a
relative basis as it is not impacted by GLP1s.
Further assisting in outperformance was Extra Space Storage Inc. within real estate. REITs outperformed in the fourth quarter as
interest rates peaked, and Extra Space Storage outperformed REITs on solid fundamentals.
Selection within utilities assisted performance with Vistra Corp. as the top name. Vistra continued to show a strong recovery in
earnings power as the company benefited from pricing during a very hot summer in Texas. The company outperformed regulated
utilities which were dealing with ROE (return on equity) pressures.
An underweight to energy, an underperforming sector, added to relative performance.
Selection within consumer discretionary positively impacted performance. Floor & Decor Holdings, Inc. Class A outperformed as
strong numbers and a desirable long-term algorithm led to the stock rising with other highly shorted names in the fourth quarter.
Selection within communication services hurt performance on a relative basis. Nexstar Media Group, Inc. detracted the most as
softness in advertising markets coupled with worries about distribution held down the stock.
The Fund also experienced negative attribution within industrials with W illScot Mobile Mini Holdings Corp. Class A being the
largest drag. WillS cot lagged due to slowing volumes coupled with an uncertain macro environment, especially in non-residential end
markets.
Outlook
As we enter 2024, we expect modest economic weakness in the first half of the year followed by economic stability and an
improvement in growth heading into the 2024 election cycle. Inflation will likely remain above the Fed’s 2% target, and with the recent
dramatic easing in financial conditions, inflation may begin to increase in the fourth quarter of 2024. Should inflation expectations
begin firming, we would expect some modest downward pressure on equity valuations.
TopTen Holdings as of December 31, 2023
Security Name
% of
Net Assets
1 Extra Space Storage, Inc. 4.20%
2 EastGroup Properties, Inc. 3.44
3 Monolithic Power Systems, Inc. 2.98
4 Constellium SE 2.69
5 IQVIA Holdings, Inc. 2.66
6 Diamondback Energy, Inc. 2.48
7 ON Semiconductor Corp. 2.47
8 Marvell Technology, Inc. 2.46
9 Skechers USA, Inc., Class A 2.45
10 Vulcan Materials Co. 2.42
The portfolio is actively managed and holdings are subject to change. There is no guarantee the Fund continues to invest in the securities referenced. The holdings listed
exclude any temporary cash investments, are presented on an individual security basis and do not represent holdings of the issuer.
VAUGHAN NEL
SO
N MID CAP FUND
23
|

Hypothetical Growth of $100,000 Investment in ClassY Shares
1
December 31, 2013 through December 31, 2023
$50,000
$100,000
$150,000
$200,000
$250,000
$300,000
$350,000
12/13 12/14 12/15 12/16 12/17 12/18 12/19 12/20 12/21 12/22 12/23
$198,931
$221,217
NAV Russell Midcap
®
Value Index
2
See notes to chart on page 25.
VAUGHAN NELS
O
N MID CAP FUND
|
2
4

Average AnnualTotal Returns —December 31, 2023
1
1 Year 5 Years 10 Years
Expense Ratios
3
Gross Net
C
lass Y
NAV
16.52% 12.88% 7.12% 0.96% 0.90%
C
lass
A
NAV
16.26 12.59 6.85 1.21 1.15
With 5.75
%
Maximum Sales Charg
e
9
.57 11.
2
7
6
.
22
Class
C
NAV
15.38 11.75 6.21 1.96 1.90
With CDSC
4
1
4.
38
11.75
6
.
21
Class N
NAV
16.56 12.94 7.19 0.87 0.85
Comparative Performanc
e
Russell Midcap® Value Inde
x
2
12.71 11.168.2
6
Performance data shown represents past performance and is no guarantee of, and not necessarily indicative of, future results. Total return and
value will vary, and you may have a gain or loss when shares are sold. Current performance may be lower or higher than quoted. For most recent
month-end performance, visit im.natixis.com/performance. Performance for other share classes will be greater or less than shown based on
differences in fees and sales charges. You may not invest directly in an index. Performance for periods less than one year is cumulative, not
annualized. Returns reflect changes in share price and reinvestment of dividends and capital gains, if any. The table(s) do not reflect taxes
shareholders might owe on any fund distributions or when they redeem their shares.
1 Fund performance has been increased by fee waivers and/or expense reimbursements, if any, without which performance would have been lower.
2 Russell Midcap
®
Value Index is an unmanaged index that measures the performance of the mid-cap value segment of the U.S. equity universe. It includes those
Russell Midcap
®
Index companies with lower price-to-book ratios and lower forecasted growth values.
3 Expense ratios are as shown in the Fund’s prospectus in effect as of the date of this report. The expense ratios for the current reporting period can be found in the
Financial Highlights section of this report under Ratios to Average Net Assets. Net expenses reflect contractual expense limitations set to expire on 4/30/24. When a
Fund’s expenses are below the limitation, gross and net expense ratios will be the same. See Note 5 of the Notes to Financial Statements for more information about
the Fund’s expense limitations.
4 Performance for Class C shares assumes a 1.00% contingent deferred sales charge (“CDSC”) applied when you sell shares within one year of purchase, and includes
automatic conversion to Class A shares after eight years.
VAUGHAN NELS
O
N MID CAP FUND
25
|

Managers
James Eisenman, CFA®
Chris D. Wallis, CFA®
Vau ghan Nelson Investment Management, L.P.
Symbols
Class A NEFJX
Class C NEJCX
Class N VSCNX
Class Y NEJYX
Investment Goal
The Fund seeks capital appreciation.
Market Conditions
During the fiscal year ending December 31, 2023, the market began with sequential growth slowing in both the first and second
quarters. Typically, banking stress develops once we are well into a recession as the ability for borrowers to service debt becomes
impaired. Given the rapid increase in interest rates, regional banks fell under tremendous pressure.
As we moved through the summer months, global growth continued to deteriorate as the impact of aggressive r ate increases affected
economic fundamentals. In the U.S., the manufacturing and transportation sectors recessed, and the service sector slowed further.
Offsetting the deteriorating economic environment were continued liquidity injections by the major non-U.S. central banks and the
U.S. Federal Reserve ’s (Fed) reverse repo facility, which became the primary source of liquidity for rebuilding the U.S. Treasury’s
general account. This flood of liquidity boosted equity markets and dampened fixed income volatility, compressing fixed income
spreads (the difference in yield between bonds with similar maturity but different credit quality).
Inflation peaked in the fourth quarter of 2022 and economic growth bottomed, which set the stage for the move higher in U.S. equity
markets during the first seven months of 2023. The reacceleration in growth coupled with declining inflation allowed the market to
begin pricing in a “soft landing” for the U.S. economy despite aggressive monetary policy tightening, the emergence of a banking crisis,
and rising U.S. Treasury yields as the U.S. Treasury struggled to fund rising deficit spending. The Fed added fuel to the rally by
aggressively pumping liquidity into the banking system to offset the material losses on bank balance sheets.
During the fourth quarter, improving supply chains, rising employment participation rates, and the lagging influence of stabilized
home prices and rental inflation continued to promote disinflationary conditions. Declining inflationary pressures, combined with
stable economic growth, produced a material improvement in financial conditions as the market discounted future Fed rate cuts
without any corresponding decrease in earnings expectations or economic weakness. The resulting decline in interest rates led to a
powerful fourth quarter rally in equity and fixed income markets.
Performance Results
For the 12 months ended December 31, 2023, Class Y shares of the Vaughan Nelson Small Cap Value Fund returned 25.10% at net
asset value. The Fund outperformed its benchmark, the Russell 2000 Value® Index, which returned 14.65%.
Explanation of Fund Performance
The Fund outperformed on a relative basis during the period.
An underweight to financials, an underperforming sector, and selection within it resulted in the top performing sector. Cboe Global
Markets Inc. was the top name due to strength in zero-day option offerings to the market which experienced material growth
combined with increased penetration of their data and analytics business.
The Fund experienced positive attribution within industrials, with Core & Main, Inc. Class A leading the way. Core & Main
outperformed due to continued pricing power maintaining high gross margins, strong and accretive merger & acquisition activity and
the exit a of private equity controlling shareholder increasing market liquidity.
Overweight and selection within information technology aided performance. The strongest name was Insight Enterprises, Inc. due to
the continued positive margin mix shift into services business from hardware business generating a higher return on assets and a
higher multiple for the company.
An underweight to health care, an underperforming sector, aided relative performance.
Selection within utilities assisted performance. Univar Solutions Inc. was the top name due to its acquisition by private equity.
Consumer staples’ outperformance was led by Coca-Cola Consolidated, Inc., which outperformed due to debt paydown and the
announcement of a 500% increase in an annual special dividend signaling to the market future material capital returns to shareholders.
VAUGHAN NELSON SMALL CAP VALUE FUND
|
26

Materials outperformed, driven by selection. Element Solutions Inc demonstrated strong cost discipline due to variable cost structure
and started taking chemicals market share from competitors.
Last, further assisting in outperformance was STAG Industrial, Inc., within real estate, due to strong re-lease rental growth of over
30% on new long-term contracts due to the value of their industrial properties to their tenants.
The largest detractor was in energy, driven by an underweight position and security selection. Patterson-UTI Energy, Inc. was the
most challenged name. The stock underperformed due to concerns about softening activity levels (rigs/fracs) in light of weakening
near-term oil and natural gas fundamentals.
Selection within consumer discretionary negatively impacted performance. Ball y's Corporation was the largest laggard due to high
leverage and continued increased capital commitments in non-core business activities.
Selection within communication services hurt on a relative basis. Gray Television, Inc. detracted the most due to high leverage and
concerns over coming contract negotiations with major networks (mainly NBC).
Outlook
As we enter 2024, we expect modest economic weakness in the first half of the year followed by economic stability and an
improvement in growth heading into the 2024 election cycle. Inflation will likel y remain above the Federal Reserve’s 2% target, and
with the recent dramatic easing in financial conditions, inflation may begin to increase in the fourth quarter of 2024. Should inflation
expectations begin firming, we would expect some modest downward pressure on equity valuations.
TopTen Holdings as of December 31, 2023
Security Name
% of
Net Assets
1 Insight Enterprises, Inc. 3.57%
2 Element Solutions, Inc. 3.42
3 First American Financial Corp. 2.28
4 Western Alliance Bancorp 2.24
5 Core & Main, Inc., Class A 2.22
6 Installed Building Products, Inc. 2.20
7 Comerica, Inc. 2.17
8 Fabrinet 2.00
9 Beacon Roofing Supply, Inc. 1.90
10 Zions Bancorp NA 1.88
The portfolio is actively managed and holdings are subject to change. There is no guarantee the Fund continues to invest in the securities referenced. The holdings listed
exclude any temporary cash investments, are presented on an individual security basis and do not represent holdings of the issuer.
VAUGHAN NELS
O
N SMALL CAP VALUE FUN
D
27
|

Hypothetical Growth of $100,000 Investment in ClassY Shares
1
December 31, 2013 through December 31, 2023
$50,000
$100,000
$150,000
$200,000
$250,000
$300,000
$350,000
12/13 12/14 12/15 12/16 12/17 12/18 12/19 12/20 12/21 12/22 12/23
$239,738
$192,261
NAV Russell 2000
®
Value Index
2
See notes to chart on page 29.
VAUGHAN NELS
O
N SMALL CAP VALUE FUN
D
|
28

Average AnnualTotal Returns —December 31, 2023
1
1 Year 5 Years 10 Years
Life of
Class N
Expense Ratios
3
Gross Net
C
lass Y
NAV
25.10% 14.94% 9.14% —% 1.12% 1.00%
C
lass
A
NAV
24.82 14.66 8.87 — 1.37 1.25
With 5.75
%
Maximum Sales Charg
e
1
7.
6
11
3
.
3
1
8
.
23
—
Class
C
NAV
23.93 13.80 8.22 — 2.12 2.00
With CDSC
4
22
.
93
1
3
.
80 8
.
22
—
Class N
(
Inception 5/1/17
)
NAV
25.24 15.03 — 9.63 1.10 0.95
Comparative Performanc
e
Russell 2000® Value Inde
x
2
1
4.65 10.00 6.766.2
8
Performance data shown represents past performance and is no guarantee of, and not necessarily indicative of, future results. Total return and
value will vary, and you may have a gain or loss when shares are sold. Current performance may be lower or higher than quoted. For most recent
month-end performance, visit im.natixis.com/performance. Performance for other share classes will be greater or less than shown based on
differences in fees and sales charges. You may not invest directly in an index. Performance for periods less than one year is cumulative, not
annualized. Returns reflect changes in share price and reinvestment of dividends and capital gains, if any. The table(s) do not reflect taxes
shareholders might owe on any fund distributions or when they redeem their shares.
1 Fund performance has been increased by fee waivers and/or expense reimbursements, if any, without which performance would have been lower.
2 Russell 2000® Value Index is an unmanaged index that measures the performance of the small-cap value segment of the U.S. equity universe. It includes those Russell
2000® companies with lower price-to-book ratios and lower forecasted growth values.
3 Expense ratios are as shown in the Fund’s prospectus in effect as of the date of this report. The expense ratios for the current reporting period can be found in the
Financial Highlights section of this report under Ratios to Average Net Assets. Net expenses reflect contractual expense limitations set to expire on 4/30/24. When a
Fund’s expenses are below the limitation, gross and net expense ratios will be the same. See Note 5 of the Notes to Financial Statements for more information about
the Fund’s expense limitations.
4 Performance for Class C shares assumes a 1.00% contingent deferred sales charge (“CDSC”) applied when you sell shares within one year of purchase, and includes
automatic conversion to Class A shares after eight years.
VAUGHAN NELS
O
N SMALL CAP VALUE FUND
2
9
|
ADDITIONAL INFORMATION
The views expressed in this report reflect those of the portfolio managers as of the dates indic ated. The managers’ vie ws are subject to
change at any time without notice based on changes in market or other conditions. References to specific securities or industries
should not be regarded as investment advice. Because the Funds are actively managed, there is no assurance that they will continue to
invest in the securities or industries mentioned.
All investing involves risk, including the risk of loss. There is no assurance that any investment will meet its performance objectives or
that losses will be avoided.
ADDITIONAL INDEX INFORMATION
This document may contain references to third party copyrights, indexes, and trademarks, each of which is the property of its
respective owner. Such owner is not affiliated with Natixis Investment Managers or any of its related or affiliated companies
(collectively “Natixis Affiliates”) and does not sponsor, endorse or participate in the provision of any Natixis Affiliates services, funds or
other financial products.
The index information contained herein is derived from third parties and is provided on an “as is” basis. The user of this information
assumes the entire risk of use of this information. Each of the third party entities involved in compiling, computing or creating index
information disclaims all warranties (including, without limitation, any warranties of originality, accuracy, completeness, timeliness,
non-infringement, merchantability and fitness for a particular purpose) with respect to such information.
PROXY VOTING INFORMATION
A description of the Natixis Funds' proxy voting policies and procedures is available without charge, upon request, by calling Natixis
Funds at 800-225-5478; on the Natixis Funds’ website at im.natixis.com, and on the Securities and Exchange Commission (“SEC”)
website at www.sec.gov. Information about how the Natixis Funds voted proxies relating to portfolio securities during the most recent
12-month period ended June 30 is available through the Natixis Funds’ website and the SEC website.
QUARTERLY PORTFOLIO SCHEDULES
The Natixis Funds file a complete schedule of portfolio holdings with the SEC for the first and third quarters of each fiscal year as an
exhibit to its reports on Form N-PORT. The Funds’ Form N-PORT reports are available on the SEC website at www.sec.gov . First
and third quarter schedules of portfolio holdings are also available at im.natixis.com/funddocuments. A hard copy may be requested
from the Fund at no charge by calling 800-225-5478.
TAILORED SHAREHOLDER REPORTS FOR MUTUAL FUNDS AND EXCHANGE-TRADED FUNDS
In October 2022, the SEC adopted rule and form amendments requiring mutual funds and exchange-traded funds to transmit concise
and visuall y engaging streamlined annual and semiannual reports that highlight key information to shareholders. Other information,
including financial statements, will no longer appear in the funds’ shareholder reports but will be available online, delivered free of
charge upon request, and filed with the SEC on a semiannual basis on Form N-CSR. The rule and form amendments have a
compliance date of July 24, 2024.
CFA® and Chartered Financial Analyst® are registered trademarks owned by the CFA Institute.
|
30

UNDERSTANDING FUND EXPENSES
As a mutual fund shareholder, you incur different costs: transaction costs, including sales charges (loads) on purchases and contingent
deferred sales charges on redemptions, and ongoing costs, including management fees, distribution and/or service fees ("12b-1 fees"),
and other fund expenses. Certain exemptions may apply. These costs are described in more detail in the Funds’ prospectus. The
following examples are intended to help you understand the ongoing costs of investing in the Funds and help you compare these with
the ongoing costs of investing in other mutual funds.
The first line in the table of each class of Fund shares shows the actual account values and actual Fund expenses you would have paid
on a $1,000 investment in the Fund from July 1, 2023 through December 31, 2023. To estimate the expenses you paid over the period,
simply divide your account value by $1,000 (for example $8,600 account value divided by $1,000 = 8.60) and multiply the result by the
number in the Expenses Paid During Per iod column as shown for your class.
The second line in the table for each class of fund shares provides information about hypothetical account values and hypothetical
expenses based on the Fund’s actual expense ratios and an assumed rate of return of 5% per year before expenses, which is not the
Fund’s actual return. The hypothetical account values and expenses may not be used to estimate the actual ending account balance or
expenses you paid on your investment for the period. You may use this information to compare the ongoing costs of investing in the
Fund and other funds. To do so, compare this 5% hypothetical example with the 5% hypothetical examples that appear in the
shareholder reports of the other funds.
Please note that the expenses shown reflect ongoing costs only, and do not include any transaction costs, such as sales charges.
Therefore, the second line in the table of each fund is useful in comparing ongoing costs only, and will not help you determine the
relative costs of owning funds. If transaction costs were included, total costs would be higher.
L
OO
MI
S
S
AYLE
S
INTERNATI
O
NAL
G
R
O
WTH FUND
B
E
G
INNIN
G
ACCO
UNT VALUE
7/
1
/
2023
ENDIN
G
ACCO
UNT VALUE
12
/
31
/
202
3
E
XPEN
S
E
S
PAID
DURING PERIOD*
7
/
1
/
2023 – 12
/
31
/
202
3
C
lass A
Actual $1,000.00 $1,027.40 $6.13
Hypothetical
(5%
return
before
expenses) $1,000.00 $1,019.16 $6.11
C
lass C
Actual $1,000.00 $1,023.10 $9.94
Hypothetical
(5%
return
before
expenses) $1,000.00 $1,015.38 $9.91
C
lass
N
Actual $1,000.00 $1,030.10 $4.61
Hypothetical
(5%
return
before
expenses) $1,000.00 $1,020.67 $4.58
C
lass
Y
Actual $1,000.00 $1,028.60 $4.86
Hypothetical
(5%
return
before
expenses) $1,000.00 $1,020.42 $4.84
* Expenses are equal to the Fund’s annualized expense ratio (after waiver/reimbursement): 1.20%, 1.95%, 0.90% and 0.95% for Class A, C, N and Y, respectively,
multiplied by the average account value over the period, multiplied by the number of days in the most recent fiscal half-year (184), divided by 365 (to reflect
the half-year period).
3
1
|

NATIXIS OAKMARK FUND
B
EGINNING
ACCO
UNT VALU
E
7
/1/2023
ENDIN
G
ACCO
UNT VALUE
12/31/202
3
E
XPENSES PAID
DURING PERIOD
*
7/1/2023 – 12/31/202
3
C
lass A
Actual $1,000.00 $1,115.00 $5.60
Hypothetical
(5%
return
before
expenses) $1,000.00 $1,019.91 $5.35
C
lass C
Actual $1,000.00 $1,110.80 $9.58
Hypothetical
(5%
return
before
expenses) $1,000.00 $1,016.13 $9.15
Class
N
Actual $1,000.00 $1,116.60 $4.00
Hypothetical
(5%
return
before
expenses) $1,000.00 $1,021.43 $3.82
Class
Y
Actual $1,000.00 $1,116.30 $4.27
Hypothetical
(5%
return
before
expenses) $1,000.00 $1,021.17 $4.08
* Expenses are equal to the Fund’s annualized expense ratio (after waiver/reimbursement): 1.05%, 1.80%, 0.75% and 0.80% for Class A, C, N and Y, respectively,
multiplied by the average account value over the period, multiplied by the number of days in the most recent fiscal half-year (184), divided by 365 (to reflect
the half-year period).
NATIXI
S
O
AKMARK INTERNATI
O
NAL FUN
D
B
E
G
INNIN
G
ACCO
UNT VALU
E
7/
1
/
2023
ENDIN
G
ACCO
UNT VALUE
12
/
31
/
202
3
E
XPEN
S
E
S
PAID
DURIN
G
PERI
O
D*
7
/
1
/
2023 – 12
/
31
/
202
3
Class A
Actual $1,000.00 $1,010.30 $5.83
Hypothetical
(5%
return
before
expenses) $1,000.00 $1,019.41 $5.85
Class C
Actual $1,000.00 $1,006.00 $9.61
Hypothetical
(5%
return
before
expenses) $1,000.00 $1,015.63 $9.65
C
lass
N
Actual $1,000.00 $1,011.20 $4.31
Hypothetical
(5%
return
before
expenses) $1,000.00 $1,020.92 $4.33
C
lass
Y
Actual $1,000.00 $1,011.40 $4.56
Hypothetical
(5%
return
before
expenses) $1,000.00 $1,020.67 $4.58
* Expenses are equal to the Fund’s annualized expense ratio (after waiver/reimbursement): 1.15%, 1.90%, 0.85% and 0.90% for Class A, C, N and Y, respectively,
multiplied by the average account value over the period, multiplied by the number of days in the most recent fiscal half-year (184), divided by 365 (to reflect
the half-year period).
|
32

NATIXIS U.S. EQUITY OPPORTUNITIES FUND
B
EGINNING
ACCO
UNT VALU
E
7
/1/2023
ENDIN
G
ACCO
UNT VALUE
12/31/202
3
E
XPENSES PAID
DURING PERIOD
*
7/1/2023 – 12/31/202
3
C
lass A
Actual $1,000.00 $1,104.10 $5.67
Hypothetical
(5%
return
before
expenses) $1,000.00 $1,019.81 $5.45
C
lass C
Actual $1,000.00 $1,099.50 $9.63
Hypothetical
(5%
return
before
expenses) $1,000.00 $1,016.03 $9.25
Class
N
Actual $1,000.00 $1,106.10 $4.03
Hypothetical
(5%
return
before
expenses) $1,000.00 $1,021.37 $3.87
Class
Y
Actual $1,000.00 $1,105.70 $4.35
Hypothetical
(5%
return
before
expenses) $1,000.00 $1,021.07 $4.18
* Expenses are equal to the Fund’s annualized expense ratio (after waiver/reimbursement): 1.07%, 1.82%, 0.76% and 0.82% for Class A, C, N and Y, respectively,
multiplied by the average account value over the period, multiplied by the number of days in the most recent fiscal half-year (184), divided by 365 (to reflect
the half-year period).
VAU
G
HAN NEL
SO
N MID
C
AP FUND
B
E
G
INNIN
G
ACCO
UNT VALU
E
7/
1
/
2023
ENDIN
G
ACCO
UNT VALUE
12
/
31
/
202
3
E
XPEN
S
E
S
PAID
DURIN
G
PERI
O
D*
7
/
1
/
2023 – 12
/
31
/
202
3
Class A
Actual $1,000.00 $1,105.20 $ 6.10
Hypothetical
(5%
return
before
expenses) $1,000.00 $1,019.41 $ 5.85
Class C
Actual $1,000.00 $1,101.10 $10.06
Hypothetical
(5%
return
before
expenses) $1,000.00 $1,015.63 $ 9.65
C
lass
N
Actual $1,000.00 $1,106.30 $ 4.51
Hypothetical
(5%
return
before
expenses) $1,000.00 $1,020.92 $ 4.33
C
lass
Y
Actual $1,000.00 $1,106.60 $ 4.78
Hypothetical
(5%
return
before
expenses) $1,000.00 $1,020.67 $ 4.58
* Expenses are equal to the Fund’s annualized expense ratio (after waiver/reimbursement): 1.15%, 1.90%, 0.85% and 0.90% for Class A, C, N and Y, respectively,
multiplied by the average account value over the period, multiplied by the number of days in the most recent fiscal half-year (184), divided by 365 (to reflect
the half-year period).
33
|

VAUGHAN NELSON SMALL CAP VALUE FUN
D
B
EGINNING
ACCOU
NT VALUE
7/1/2023
ENDIN
G
ACCOU
NT VALUE
12/31/202
3
E
XPENSES PAID
DURING PERIOD
*
7/1/2023 – 12/31/202
3
Class A
Actual $1,000.00 $1,089.40 $ 6.58
Hypothetical
(5%
return
before
expenses) $1,000.00 $1,018.90 $ 6.36
C
lass C
Actual $1,000.00 $1,085.70 $10.51
Hypothetical
(5%
return
before
expenses) $1,000.00 $1,015.12 $10.16
Class
N
Actual $1,000.00 $1,091.60 $ 5.01
Hypothetical
(5%
return
before
expenses) $1,000.00 $1,020.42 $ 4.84
Class
Y
Actual $1,000.00 $1,090.90 $ 5.27
Hypothetical
(5%
return
before
expenses) $1,000.00 $1,020.16 $ 5.09
* Expenses are equal to the Fund’s annualized expense ratio (after waiver/reimbursement): 1.25%, 2.00%, 0.95% and 1.00% for Class A, C, N and Y, respectively,
multiplied by the average account value over the period, multiplied by the number of days in the most recent fiscal half-year (184), divided by 365 (to reflect
the half-year period).
|
3
4

Shares Description Value (†)
Common Stocks — 97.5% of Net Asset
s
A
ustralia — 4.4%
26,340 WiseTech Global Ltd. $ 1,350,04
4
B
e
l
g
i
um — 2.1
%
9,955 Anheuser-Busch InBev SA 642,576
Brazil — 10.2
%
385,863 Ambev SA, ADR 1,080,41
6
1,310 MercadoLibre, Inc.(a) 2,058,71
8
3,139,13
4
C
anada — 3.4%
13,356 Shopify, Inc., Class A
(
a
)
1,040,433
C
hina — 22.2
%
4,219 Alibaba Group Holding Ltd., ADR(b) 327,01
5
5,158 Baidu, Inc., ADR(a)(b) 614,266
70,200 Budweiser Brewing
C
o. APA
C
Ltd. 131,60
4
4,000 Kweichow Moutai
C
o. Ltd.,
C
lass A 969,117
4,467 NXP
S
emiconductors NV 1,025,981
30,100 Tencent Holdings Ltd.(b) 1,136,421
29,855 Trip.com Group Ltd., ADR(a)(b) 1,075,078
50,135 Vipshop Holdings Ltd., ADR(a)(b) 890,398
15,129 Yum China Holdings, Inc. 641,923
6
,
8
11,
803
Denmark — 6.9%
20,383 Novo Nordisk A
S,
C
lass B 2,112,31
4
F
rance — 4.8%
3,068 EssilorLuxottica SA 616,051
7,813 Sodexo SA 860,120
1,47
6
,171
G
ermany — 3.4%
6,916
S
AP
S
E 1,064,521
J
apan — 3.6
%
30,200 FANU
C
C
orp. 886,343
6,400
Unicharm
C
orp. 231,471
1,117,81
4
M
acau — 0.8
%
44,000 Galaxy Entertainment Group Ltd. 246,43
8
N
et
h
er
l
an
d
s — 5.6
%
1,337 Adyen NV
(
a
)
1,725,988
S
witzerland — 5.0
%
8,070 CRISPR Therapeutics AG(a) 505,182
9,500 Novartis AG, (Registered) 959,600
1,900 Sandoz Group AG(a) 61,131
1
,5
2
5,
9
1
3
United Kingdom — 5.5
%
8,068 Diageo PL
C
292,829
11,825 Reckitt Benckiser Group PLC 815,965
11,982 Unilever PLC 580,737
1
,689,531
U
nited
S
tates — 19.6%
11,515 ARM Holdings PLC, ADR
(
a
)
865,29
5
9,083 Block, Inc.
(
a
)
702,57
0
17,146 Doximity, Inc., Class A
(
a
)
480,774
22,214 Experian PLC 906,227
8,434 Nestle SA,
(
Registered
)
977,66
8
S
hares Description Value (†)
U
nited
S
tates — continued
3
,185 Roche Holding AG $ 925,85
9
4,
723 Tesla, Inc.(a) 1,173,571
6
,
03
1,
964
T
otal Common Stocks
(Identified Cost
$
30,378,194) 29,974,64
4
Principa
l
A
mount
S
hort-Term Investments — 1.6%
$
483,572 Tri-Party Repurchase Agreement with Fixed Income
C
learing Corporation, dated 12/29/2023 at 2.500% to be
r
epurchased at $483,707 on 1/02/2024 collateralized by
$
512,200 U.S. Treasury Note, 2.500% due 3/31/2027
v
alued at $493,280 including accrued interest
(Note 2 of Notes to Financial Statements)
(Identified Cost $483,572) 483,572
Total Investments — 99.1%
(Identified Cost
$
30,861,766) 30,458,216
O
ther assets less liabilities — 0.9% 265,796
N
et Assets — 100.0% $30,724,012
(†) See Note 2 of Notes to Financial Statements.
(a) Non-income producing security.
(b) Security invests in variable interest entities based in China. See
Note 8 of Notes to Financial Statements.
ADR An American Depositary Receipt is a certificate issued by a
custodian bank representing the right to receive securities of the
foreign issuer described. The values of ADRs may be significantly
influenced by trading on exchanges not located in the
United States.
Industry Summary at December 31, 2023
Pharmaceuticals 13.2%
B
roa
dli
ne
R
eta
il
10.7
B
everages 10.1
Hotels, Restaurants & Leisure
9.
2
F
inancial
S
ervices 7.9
S
oftware 7.8
S
emiconductors
&
S
emiconductor Equipment 6.
1
Interactive Media
&
S
ervices 5.7
A
utomobiles 3.8
H
ouse
h
o
ld
P
ro
d
ucts 3.4
IT
S
ervices 3.4
F
oo
d
P
ro
d
ucts 3.2
Professional
S
ervices 2.9
M
ac
hi
nery 2.
9
Health Care Equipment & Supplies 2.
0
O
ther Investments, less than 2% each 5.2
S
hort-Term Investments 1.6
T
ota
l
I
nvestments 99.
1
O
ther assets less liabilities 0.
9
N
et Assets 100.0
%
Portfolio of Investments – as of December 31, 2023
Loomis Sayles International Growth Fund
S
ee accompanying notes to financial statements.
35
|

Currency Exposure Summary at December 31, 2023
United States Dollar 42.3%
E
uro 17.
8
Swiss Franc 9.
5
D
an
i
s
h
K
rone 6.9
B
r
i
t
i
s
h
P
oun
d
6.5
H
ong
K
ong
D
o
ll
ar 4.9
A
ustra
li
an
D
o
ll
ar 4.
4
J
apanese Yen 3.6
Y
uan
R
enm
i
n
bi
3.2
T
ota
l
I
nvestments 99.
1
O
ther assets less liabilities 0.
9
N
et Assets 100.0
%
Portfolio of Investments – as of December 31, 202
3
Loomis Sayles International Growth Fund (continued
)
S
ee accompanying notes to financial statements.
|
36

Shares Description Value (†)
Common Stocks — 94.7% of Net Asset
s
Automobile Components — 2.8%
212,967 BorgWarner, Inc. $ 7,634,867
155,200
M
agna
I
nternat
i
ona
l
,
I
nc. 9,169,216
38,911 Phinia, Inc. 1,178,614
17,
982
,
69
7
A
utomo
bil
es — 2.1
%
381,760
G
eneral Motors
C
o. 13,712,81
9
Banks — 9.5%
413,536 Bank of America Corp. 13,923,757
225,918 Citigroup, Inc. 11,621,222
6,240 First
C
itizens Banc
S
hares, Inc.,
C
lass A 8,854,373
259,600 Truist Financial
C
orp. 9,584,43
2
335,804 Wells Fargo
&
C
o. 16,528,273
60
,51
2
,
0
57
B
roa
dli
ne
R
eta
il
— 2.1%
50,200 Amazon.com, Inc.(a) 7,627,38
8
140,365 e
B
ay,
I
nc. 6,122,721
1
3
,75
0
,1
09
Building Products — 3.2%
120,600 Fortune Brands Innovations, Inc. 9,182,484
167,600 Masco Corp. 11,225,848
20
,4
08
,
332
Capital Markets — 14.6
%
222,482 Bank of New York Mellon
C
orp. 11,580,188
9,075
Bl
ac
kR
oc
k
,
I
nc. 7,367,08
5
194,339 Charles Schwab Corp. 13,370,52
3
24,298
G
oldman
S
achs
G
roup, Inc. 9,373,440
137,766
I
ntercont
i
nenta
l
E
xc
h
ange,
I
nc. 17,693,28
7
196,010 KKR & Co., Inc. 16,239,429
14,221
Moody's
C
orp. 5,554,15
4
151,866
S
tate
S
treet
C
orp. 11,763,540
9
2,941,646
C
hemicals — 2.7
%
50,566
C
elanese
C
orp. 7,856,43
9
195,200 Corteva, Inc. 9,353,98
4
1
7,210,423
Communications Equipment — 0.9
%
114,500 Cisco Systems, Inc. 5,784,540
Consumer Finance — 7.3
%
396,054
All
y
Fi
nanc
i
a
l
,
I
nc. 13,830,205
79,473 American Express
C
o. 14,888,472
137,406
C
apital
O
ne Financial
C
orp. 18,016,67
5
4
6,735,352
Consumer Staples Distribution & Retail — 2.1
%
296,100 Kroger
C
o. 13,534,73
1
Electronic Equipment, Instruments & Components — 0.9%
40,065 TE
C
onnectivity Ltd. 5,629,132
E
nterta
i
nment — 2.3%
57,800 Walt Disney
C
o. 5,218,762
810,200 Warner Bros Discovery, Inc.(a) 9,220,07
6
14,4
38
,
838
Financial
S
ervices — 3.7
%
112,269 Fiserv, Inc.(a) 14,913,81
4
67,700 Global Payments, Inc. 8,597,90
0
23
,511,71
4
S
hares Description Value (†)
Health Care Equipment & Supplies — 1.0
%
1
71,800 Baxter International, Inc. $ 6,641,788
Health
C
are Providers
&
S
ervices — 4.0%
1
51,480 Centene Corp.(a) 11,241,331
84,300 CVS Health Corp. 6,656,328
28,219 H
C
A Healthcare, Inc. 7,638,31
9
2
5,5
3
5,
9
7
8
Hotels, Restaurants
&
Leisure — 0.9
%
3
0,928 Hilton Worldwide Holdings, Inc. 5,631,68
0
I
nsurance — 5.1
%
2
24,335 American International
G
roup, Inc. 15,198,696
30,437 Reinsurance
G
roup of America, Inc. 4,924,09
8
51,963 Willis Towers Watson PLC 12,533,47
6
3
2,656,27
0
Interactive Media
&
S
ervices — 4.5
%
1
50,020 Alphabet, Inc., Class A(a) 20,956,294
21,266 Meta Platforms, Inc., Class A(a)
7,527,31
3
28
,4
83
,
60
7
L
ife Sciences Tools & Services — 3.3
%
23,100 Danaher Corp. 5,343,95
4
67,100 IQVIA Holdings, Inc.(a) 15,525,598
20
,
869
,55
2
Media — 5.1%
3
0,074 Charter Communications, Inc., Class A(a) 11,689,16
2
347,542 Comcast Corp., Class A 15,239,71
7
66,700 Liberty Broadband Corp., Class C(a) 5,375,353
32
,
30
4,
232
O
il,
G
as
&
C
onsumable Fuels — 8.6%
350,472 APA
C
orp. 12,574,935
141,830
C
onocoPhillips 16,462,20
8
113,260 E
OG
Resources, Inc. 13,698,797
91,100 Phillips 66 12,129,054
5
4,864,994
Professional
S
ervices — 1.1
%
27,400 Equi
f
ax, Inc. 6,775,74
6
R
eal Estate Management & Development — 2.3
%
157,318 CBRE Group, Inc., Class A(a) 14,644,73
3
S
oftware — 2.9
%
7
0,300 Oracle Corp. 7,411,72
9
4
1,900 Salesforce, Inc.(a) 11,025,566
1
8
,4
3
7,
295
T
o
b
acco — 1.7%
264,414 Altria Group, Inc. 10,666,461
T
otal
C
ommon
S
tocks
(Identified Cost
$
520,726,283) 603,664,726
Portfolio of Investments – as of December 31, 202
3
Natixis Oakmark Fund
S
ee accompanying notes to financial statements.
37
|

P
r
i
nc
ip
a
l
Amount Description Value (†)
S
hort-Term Investments — 5.0%
$32,116,607 Tri-Party Repurchase Agreement with Fixe
d
Income
C
learing
C
orporation, dated 12/29/2023 a
t
2.500% to be repurchased at $32,125,528 on
1/02/2024 collateralized by $36,628,20
0
U.S. Treasury Note, 0.500% due 4/30/2027 valued at
$32,758,985 including accrued interest (Note 2 of
Notes to Financial Statements)
(Identified Cost $32,116,607)
$ 32,116,607
Total Investments — 99.7
%
(Identified Cost
$
552,842,890) 635,781,333
Other assets less liabilities — 0.3
%
1,710,302
Net Assets — 100.0% $637,491,63
5
(†) See Note 2 of Notes to Financial Statements.
(a) Non-income producing security.
Industry Summary at December 31, 2023
Capital Markets 14.6%
B
an
k
s 9.5
Oil, Gas & Consumable Fuels 8.6
C
onsumer Finance 7.3
I
nsurance 5.1
M
e
di
a5.
1
Interactive Media
&
S
ervices 4.
5
Health Care Providers & Services 4.0
Financial Services 3.7
Life Sciences Tools & Services
3.
3
B
u
ildi
ng
P
ro
d
ucts 3.2
Software 2.9
Automobile Components 2.
8
Chemicals 2.
7
Real Estate Management & Development 2.
3
E
nterta
i
nment 2.
3
B
roa
dli
ne
R
eta
il
2.1
A
utomo
bil
es 2.1
C
onsumer
S
taples Distribution
&
Retail 2.
1
Other Investments, less than 2% each 6.5
Short-Term Investments 5.0
T
ota
l
I
nvestments 99.
7
O
ther assets less liabilities 0.
3
N
et Assets 100.0
%
Portfolio of Investments – as of December 31, 202
3
Natixis Oakmark Fund (continued
)
S
ee accompanying notes to financial statements.
|
38

Shares Description Value (†)
Common Stocks — 94.5% of Net Asset
s
Belgium — 1.3
%
80,500 Anheuser-Busch InBev SA $ 5,196,122
C
anada — 1.7%
160,800 Open Text Corp. 6,758,19
9
C
hina — 1.4
%
545,300 Alibaba Group Holding Ltd. 5,252,621
D
enmar
k
— 1.2
%
26,000 DSV AS 4,568,374
F
rance — 16.4
%
186,205 Accor SA 7,127,19
9
173,991 BNP Paribas
S
A 12,082,92
0
29,300 Capgemini SE 6,123,45
2
72,600 Danone
S
A 4,710,18
0
75,463 Edenred SE 4,516,062
85,500 Eurofins
S
cientific
S
E 5,577,37
1
22,440 Kering SA 9,938,63
8
45,198 Publicis Groupe SA 4,199,428
293,325 Valeo SE 4,533,519
282,151
Worldline SA
(
a
)
4,906,60
4
6
3,715,37
3
G
ermany — 25.7
%
22,900 adidas AG 4,653,43
3
29,710 Allianz
S
E 7,939,73
7
268,730 Bayer AG 9,970,93
1
76,900 Bayerische Motoren Werke AG 8,556,79
2
54,100 Brenntag
S
E 4,972,195
115,173
C
ontinental A
G
9,781,802
213,207 Daimler Truck Holding A
G
8,008,918
227,600 Fresenius Medical
C
are A
G
9,515,56
1
265,700 Fresenius
S
E
&
C
o. K
G
aA 8,235,514
55,842 Henkel AG & Co. KGaA 4,006,58
5
152,414 Mercedes-Benz Group AG, (Registered) 10,516,232
28,300 SAP SE 4,355,97
9
3
5,600
S
iemens A
G
6,678,89
0
385,000 thyssenkrupp AG 2,678,23
2
9
9,870,801
I
ndia — 0.7%
195,475
A
x
i
s
B
an
k
L
t
d
. 2,586,988
I
ndonesia — 0.2
%
1,482,900
B
an
k
M
an
di
r
i
P
ersero
Tbk
.
PT
582,539
Ireland — 1.6
%
47,238 Ryanair Holdings PLC, ADR(a) 6,299,660
I
ta
l
y — 2.4
%
3
,150,700 Intesa Sanpaolo SpA 9,220,187
Japan — 3.4%
36,200 Fujitsu Ltd.
5,447,86
9
141,600 Komatsu Ltd. 3,684,90
5
93,400 Recruit Holdings Co. Ltd. 3,905,158
1
3,037,932
K
orea — 1.9%
43,232 NAVER
C
orp. 7,480,010
N
et
h
er
l
an
d
s — 4.7
%
45,500
Ak
zo
N
o
b
e
l
NV
3,767,708
64,644 EX
O
R NV 6,470,710
267,896
P
rosus
NV
7,973,73
6
1
8
,
2
1
2
,15
4
S
hares Description Value (†)
Sp
ain — 1.4
%
76,630 Amadeus IT Group SA $ 5,503,68
5
S
weden — 3.8
%
1
39,500 Sandvik AB 3,030,685
3
11,703 SKF AB, Class B 6,246,699
2
10,600 Volvo AB,
C
lass B 5,479,81
2
14,757,19
6
S
witzerland — 8.0
%
26,400 Cie Financiere Richemont SA, Class A 3,646,475
1,070,980
G
lencore PL
C
6,437,709
57,021 Holcim A
G
4,478,508
3
8,400 Novartis AG, (Registered) 3,878,80
3
17,090 Roche Holding A
G
4,967,952
13,200 Schindler Holding AG 3,304,685
16,599 Swatch Group AG 4,516,42
4
3
1,
230
,55
6
U
n
i
te
d
Ki
n
gd
om — 18.7
%
69,600 Ashtead Group PLC 4,837,697
19,800 Bunzl PLC 804,583
1
,139,492 CNH Industrial NV 13,973,668
97,200 Compass Group PLC 2,659,715
253,377 Informa PLC
2,520,19
0
218,963 Liberty Global Ltd., Class A(a) 3,890,97
2
22,560,100 Lloyds Banking Group PLC 13,683,510
871,000
Prudential PL
C
9,827,21
9
61,300 Reckitt Benckiser Group PLC 4,229,909
1,
369,682
S
chroders PL
C
7,489,090
96,200 Smiths Group PLC 2,159,24
9
699,200 WPP PL
C
6,678,67
5
72
,754,477
T
otal Common Stocks
(Identified Cost $335,101,987)
367,026,874
P
referred
S
tocks — 1.7
%
K
orea — 1.7
%
140,000 Samsung Electronics Co. Ltd., 2.319
%
, (KRW
)
(Identified Cost
$
7,538,747) 6,746,11
1
P
r
i
nc
ip
a
l
A
moun
t
S
hort-Term Investments — 2.5%
$
9,624,351 Tri-Party Repurchase Agreement with Fixed
Income
C
learing
C
orporation, dated 12/29/2023 a
t
2.500% to be repurchased at
$
9,627,025 o
n
1/02/2024 collateralized by
$
10,976,40
0
U.S. Treasury Note, 0.500
%
due 4/30/2027 valued a
t
$
9,816,909 including accrued interest (Note 2 o
f
Notes to Financial Statements
)
(Identified Cost
$
9,624,351) 9,624,35
1
Total Investments — 98.7
%
(Identified Cost $352,265,085) 383,397,33
6
Other assets less liabilities — 1.3% 5,234,98
2
Net Assets — 100.0%
$
388,632,31
8
(†) See Note 2 of Notes to Financial Statements.
(a) Non-income producing security.
Portfolio of Investments – as of December 31, 202
3
Natixis Oakmark International Fund
S
ee accompanying notes to financial statements.
3
9
|

ADR An American Depositary Receipt is a certificate issued by a
custodian bank representing the right to receive securities of the
foreign issuer described. The values of ADRs may be significantly
influenced by trading on exchanges not located in the
United States.
KRW South Korean Won
Industry Summary at December 31, 2023
Machinery 11.3%
B
an
k
s 9.9
Textiles, Apparel
&
Luxury
G
oods 5.8
A
utomo
bil
es 4.9
Ph
armaceut
i
ca
l
s4.9
Health
C
are Providers
&
S
ervices 4.6
Insurance 4.5
Financial Services 4.
2
Hotels, Restaurants
&
Leisure 3.9
Automobile Components 3.
7
Media 3.
5
Broadline Retail 3.4
IT
Services 3.
0
S
oftware 2.8
Trading Companies & Distributors 2.7
Metals
&
Mining 2.4
Industrial
C
onglomerates 2.
3
Household Products 2.
1
Other Investments, less than 2% each 16.
3
Short-Term Investments 2.
5
T
ota
l
I
nvestments 98.
7
Other assets less liabilities 1.
3
N
et Assets 100.0
%
Currency Exposure Summary at December 31, 2023
E
uro 55.5
%
British Pound 15.
8
S
wiss Franc 6.
3
U
nited States Dollar 5.
1
S
wedish Krona 3.8
S
outh Korean Won 3.6
J
apanese
Y
en 3.4
O
ther, less than 2% each 5.2
T
ota
l
I
nvestments 98.
7
O
ther assets less liabilities 1.3
N
et Assets 100.0%
Portfolio of Investments – as of December 31, 202
3
Natixis Oakmark International Fund
(
continued
)
S
ee accompanying notes to financial statements.
|
40

Shares Description Value (†)
Common Stocks — 97.6% of Net Asset
s
Aerospace & Defense — 2.4
%
87,555 Boeing Co.(a) $ 22,822,086
Air Freight
&
Logistics — 0.6%
4
5,126 Expeditors International o
f
Washington, Inc. 5,740,027
Automobile
C
omponents — 1.9%
391,300
B
or
gW
arner,
I
nc. 14,028,10
5
96,655 Mobileye Global, Inc., Class A(a) 4,187,095
18,215,20
0
A
utomo
bil
es — 1.8
%
5,000 General Motors Co. 179,60
0
69,146 Tesla, Inc.
(
a
)
17,181,398
17,360,998
B
an
k
s — 4.6
%
721,300 Bank of America Corp. 24,286,171
69,800 Citigroup, Inc. 3,590,512
330,000 Wells Fargo & Co. 16,242,600
4
4,119,283
B
everages — 2.2
%
12,379 Boston Beer Co., Inc., Class A(a) 4,278,05
9
291,915 Monster Beverage Corp.(a) 16,817,22
3
2
1,
09
5,
282
Bi
otec
h
no
l
ogy — 2.5%
51,541 Alnylam Pharmaceuticals, Inc.(a) 9,865,463
58,302 CRISPR Therapeutics AG(a)
3,649,70
5
11,925 Regeneron Pharmaceuticals, Inc.(a) 10,473,60
8
23
,
988
,77
6
Broadline Retail — 4.4
%
46,779 Alibaba
G
roup Holding Ltd., ADR 3,625,840
258,252 Amazon.com, Inc.(a) 39,238,809
42,864,64
9
B
u
ildi
ng
P
ro
d
ucts — 1.5
%
214,800 Masco Corp. 14,387,304
C
apital Markets — 12.2%
294,100 Bank of New York Mellon Corp.
15,307,90
5
291,345 Charles Schwab Corp. 20,044,536
14,248 FactSet Research Systems, Inc. 6,797,00
9
36,400 Goldman Sachs Group, Inc. 14,042,02
8
175,800
I
ntercont
i
nenta
l
E
xc
h
ange,
I
nc. 22,577,99
4
322,800 KKR & Co., Inc. 26,743,98
0
11,788 MSCI, Inc. 6,667,882
88,933 SEI Investments Co.
5,651,69
2
117,
833
,
026
C
onsumer Finance — 5.8
%
369,700 Ally Financial, Inc. 12,909,924
82,400 American Express Co. 15,436,816
210,985
C
apital
O
ne Financial
C
orp. 27,664,353
56,011,09
3
C
onsumer
S
taples Distribution
&
Retail — 1.6%
342,500 Kroger Co. 15,655,675
E
nterta
i
nment — 4.3
%
40,821 Netflix, Inc.(a) 19,874,92
9
116,005 Walt Disney
C
o. 10,474,091
990,500 Warner Bros Discovery, Inc.(a)
11,271,89
0
4
1,
620
,
9
1
0
S
hares Description Value (†)
Financial
S
ervices — 4.5
%
68,566 Block, Inc.(a) $ 5,303,580
119,100 Fiserv, Inc.(a) 15,821,24
4
64,032 PayPal Holdings, Inc.(a) 3,932,205
69,844 Visa, Inc., Class A 18,183,886
43
,
2
4
0
,
9
15
H
ealth
C
are Equipment
&
S
upplies — 1.2%
194,600
B
axter
I
nternat
i
ona
l
,
I
nc. 7,523,23
6
13,411 Intuitive Surgical, Inc.
(
a
)
4,524,335
12,047,571
Health
C
are Providers
&
S
ervices — 0.8%
28,000 H
C
A Healthcare, Inc. 7,579,04
0
Health
C
are Technology — 1.4
%
217,289 Doximity, Inc., Class A(a) 6,092,78
4
3
8,833 Veeva Systems, Inc., Class A(a) 7,476,129
1
3
,5
68
,
9
1
3
Hotels, Restaurants & Leisure — 1.6
%
7
6,220 Starbucks Corp. 7,317,882
96,037 Yum China Holdings, Inc.
4,074,85
0
3
0,307
Y
um
!
B
ran
d
s,
I
nc. 3,959,913
1
5,352,645
I
nsurance — 1.7
%
6
9,500 Willis Towers Watson PL
C
16,763,400
Interactive Media & Services — 8.6%
315,765 Alphabet, Inc., Class A(a) 44,109,21
3
3
7,751 Alphabet, Inc., Class C(a) 5,320,248
95,260 Meta Platforms, Inc., Class A(a) 33,718,230
83
,147,
69
1
IT
S
ervices — 0.8%
9
3,926 Shopify, Inc., Class A
(
a
)
7,316,835
Life
S
ciences Tools
&
S
ervices — 2.5%
3
8,556 Illumina, Inc.(a) 5,368,537
8
1,700 IQVIA Holdings, Inc.(a) 18,903,746
2
4,
2
7
2
,
283
M
ac
hi
nery — 0.3
%
7,413 Deere & Co. 2,964,236
M
e
di
a — 4.2
%
57,710 Charter Communications, Inc., Class A(a) 22,430,72
3
4
01,980 Comcast Corp., Class A 17,626,823
4
0
,
0
57,54
6
O
il,
G
as
&
C
onsumable Fuels — 5.0
%
3
40,941 APA
C
orp. 12,232,96
3
167,900 ConocoPhillips 19,488,153
133,538 E
OG
Resources, Inc. 16,151,421
47,
8
7
2
,5
3
7
Pharmaceuticals — 1.6
%
36,085 Novartis AG, ADR 3,643,50
2
73,405 Novo Nordisk A
S,
ADR 7,593,747
1
09,073 Roche Holding AG, ADR 3,951,715
7
,348 Sandoz Group AG, ADR(a) 235,210
15,424,17
4
Real Estate Management
&
Development — 1.9
%
2
00,000 CBRE Group, Inc., Class A
(
a
)
18,618,00
0
S
emiconductors & Semiconductor Equipment — 4.9
%
92,608 ARM Holdings PLC, ADR(a) 6,959,02
8
Portfolio of Investments – as of December 31, 202
3
Natixis U.S. Equity Opportunities Fund
S
ee accompanying notes to financial statements.
41
|

Shares Description Value (†)
S
emiconductors & Semiconductor Equipment — continue
d
6
6,100 NVIDIA Corp. $ 32,734,042
54,454 QUALCOMM, Inc. 7,875,682
47,5
68
,75
2
S
oftware — 9.2
%
55,910 Autodesk, Inc.
(
a
)
13,612,96
7
37,254 Microsoft Corp. 14,008,994
240,582
O
racle
C
orp. 25,364,560
9
8,736 Salesforce, Inc.
(
a
)
25,981,391
3
5,974 Workday, Inc., Class A
(
a
)
9,930,983
88,898,89
5
Textiles, Apparel & Luxury Goods — 0.3
%
3
58,058 Under Armour, Inc., Class A
(
a
)
3,147,330
T
o
b
acco — 1.3
%
3
06,400 Altria Group, Inc. 12,360,17
6
Total
C
ommon
S
tock
s
(Identified Cost
$
627,240,002) 941,915,248
Principal
Amount
Short-Term Investments — 2.3
%
$22,287,241 Tri-Party Repurchase Agreement with Fixe
d
Income
C
learing
C
orporation, dated 12/29/2023 a
t
2.500% to be repurchased at $22,293,432 on
1/02/2024 collateralized by $19,483,30
0
U.S. Treasury Note, 0.500% due 4/30/2027 valued at
$17,425,184; $5,213,500 U.S. Treasury Note, 4.125
%
due 9/30/2027 valued at $5,307,928 includin
g
accrued interest (Note 2 of Notes to Financia
l
Statements)
(Identified Cost $22,287,241)
22,287,241
Total Investments — 99.9%
(Identified Cost
$
649,527,243) 964,202,489
Other assets less liabilities — 0.1
%
1,258,783
Net Assets — 100.0% $965,461,27
2
(†) See Note 2 of Notes to Financial Statements.
(a) Non-income producing security.
ADR An American Depositary Receipt is a certificate issued by a
custodian bank representing the right to receive securities of the
foreign issuer described. The values of ADRs may be significantly
influenced by trading on exchanges not located in the
United States.
Industry Summary at December 31, 2023
C
apital Markets 12.2%
S
oftware 9.2
Interactive Media & Services 8.6
C
onsumer Finance 5.
8
O
il,
G
as
&
C
onsumable Fuels 5.0
S
emiconductors & Semiconductor Equipment 4.
9
B
an
k
s 4.6
F
inancial Services 4.5
B
roa
dli
ne
R
eta
il
4.4
E
nterta
i
nment 4.
3
M
e
di
a 4.2
L
ife
S
ciences Tools
&
S
ervices 2.5
Bi
otec
h
no
l
ogy 2.5
A
erospace & Defense 2.4
B
everages 2.
2
O
ther Investments, less than 2% each 20.3
S
hort-Term Investments 2.3
T
ota
l
I
nvestments 99.
9
O
ther assets less liabilities 0.1
N
et Assets 100.0
%
Portfolio of Investments – as of December 31, 202
3
Natixis U.S. Equity Opportunities Fund
(
continued
)
S
ee accompanying notes to financial statements.
|
4
2

Shares Description Value (†)
Common Stocks — 98.7% of Net Asset
s
Aerospace & Defense — 1.4%
13,580 Axon Enterprise, Inc.(a) $ 3,508,12
1
B
an
k
s — 7.7
%
88,845 Bank of NT Butterfield & Son Ltd. 2,843,929
98,920
C
omerica, Inc. 5,520,72
5
83,790
W
estern
Alli
ance
B
ancorp 5,512,544
122,870 Zions Bancorp NA 5,390,307
19,267,505
B
u
ildi
ng
P
ro
d
ucts — 2.1
%
31,530 Allegion PLC 3,994,53
5
33,855 AZEK Co., Inc.(a) 1,294,954
5,
289
,4
89
C
apital Markets — 6.1%
20,475 Ares Management
C
orp.,
C
lass A 2,434,88
7
9,675 M
SC
I, Inc. 5,472,66
4
44,305
N
as
d
aq,
I
nc. 2,575,892
43,542
R
aymon
d
J
ames
Fi
nanc
i
a
l
,
I
nc. 4,854,93
3
15,
338
,
3
7
6
C
hemicals — 1.5
%
108,855 Axalta Coating Systems Ltd.(a) 3,697,80
4
C
ommercial
S
ervices
&
S
upplies — 0.5%
7,580 Republic Services, Inc. 1,250,01
8
C
ommunications Equipment — 0.9%
7,265 Motorola
S
olutions, Inc. 2,274,599
C
onstruction
&
Engineering — 2.3
%
130,535 WillScot Mobile Mini Holdings Corp.(a) 5,808,808
C
onstruction Materials — 2.4%
26,675 Vulcan Materials
C
o. 6,055,49
2
C
onsumer
S
taples Distribution
&
Retail — 1.0%
37,585 Performance Food Group Co.(a) 2,599,00
3
C
ontainers
&
Packaging — 2.2
%
21,105 Avery Dennison
C
orp. 4,266,587
13,010
C
rown Holdings, Inc. 1,198,09
1
5,4
6
4,
6
7
8
El
ectr
i
ca
l
Eq
u
ip
ment — 5.1
%
18,320 AMETEK, Inc. 3,020,785
3,905
H
u
bb
e
ll
,
I
nc. 1,284,472
47,750 nVent Electric PLC
2,821,54
7
116,295 Vertiv Holdings Co. 5,585,64
9
1
2
,71
2
,45
3
Electronic Equipment, Instruments & Components — 2.4%
18,605 CDW Corp.
4,229,288
9,130 Fabrinet(a) 1,737,71
3
5,
96
7,
001
Energy Equipment
&
S
ervices — 2.0
%
245,740 TechnipFM
C
PL
C
4,949,204
Financial
S
ervices — 0.9
%
24,032 Apollo Global Management, Inc. 2,239,54
2
Ground Transportation — 1.0%
5,945 Saia, Inc.
(
a
)
2,605,218
Health
C
are Providers
&
S
ervices — 1.5
%
6,115 Cencora, Inc. 1,255,89
9
10,510 Laboratory Corp. of America Holdings 2,388,818
3,644,717
S
hares Description Value (†)
I
ndependent Power & Renewable Electricity Producers — 1.9%
125,195 Vistra Corp. $ 4,822,511
I
n
d
ustr
i
a
l
REIT
s — 3.4
%
4
6,950 EastGroup Properties, Inc. 8,617,203
I
nsurance — 4.0
%
1
6,625 Allstate Corp. 2,327,167
4,795 Arthur J Gallagher & Co. 1,078,300
2
0,015 First American Financial Corp. 1,289,766
3
2,560 Reinsurance Group of America, Inc. 5,267,557
9
,
962
,7
90
I
T
S
ervices — 2.3%
14,355 MongoDB, Inc.
(
a
)
5,869,04
2
L
ife
S
ciences Tools
&
S
ervices — 6.5%
21,995
Agil
ent
T
ec
h
no
l
o
gi
es,
I
nc. 3,057,96
5
152,505 Avantor, Inc.(a) 3,481,689
40,920 Bruker Corp.
3,006,80
2
28,777 IQVIA Holdings, Inc.(a) 6,658,42
2
16
,
20
4,
8
7
8
Machinery — 2.4
%
21,190
C
rane
C
o. 2,503,386
39,110 Otis Worldwide Corp. 3,499,172
6,002,558
M
e
di
a — 0.4
%
7
,120 Nexstar Media
G
roup, Inc. 1,116,060
Metals
&
Mining — 2.7
%
3
38,115 Constellium SE(a) 6,748,775
M
ortgage Real Estate Investment Trusts
(
REITs
)
— 1.7
%
4
02,060 Rithm Capital Corp. 4,294,001
O
il,
G
as
&
C
onsumable Fuels — 4.0
%
40,055 Diamondback Energy, Inc. 6,211,72
9
121,145 Range Resources Corp. 3,687,65
4
9
,899,383
P
rofessional
S
ervices — 5.3
%
15,475 CACI International, Inc., Class A
(
a
)
5,011,734
10,135 Equi
f
ax, Inc. 2,506,284
69,775
M
ax
i
mus,
I
nc. 5,851,331
13,369,34
9
S
emiconductors
&
S
emiconductor Equipment — 7.9
%
102,110
M
arve
ll
T
ec
h
no
l
ogy,
I
nc. 6,158,25
4
11,860 Monolithic Power
S
ystems, Inc. 7,481,05
1
7
4,140 ON Semiconductor Corp.(a) 6,192,91
4
19,832,21
9
S
oftware — 1.8
%
1
0,565 Tyler Technologies, Inc.(a) 4,417,438
Sp
ecialized REITs — 4.2
%
6
5,670 Extra
S
pace
S
torage, Inc. 10,528,871
Sp
ecialty Retail — 4.6
%
1,057 AutoZone, Inc.(a) 2,732,990
4
9,190 Floor & Decor Holdings, Inc., Class A(a) 5,487,63
6
6,950 Ulta Beauty, Inc.(a) 3,405,431
1
1,
626
,
0
57
Textiles, Apparel & Luxury Goods — 2.4
%
98,460 Skechers USA, Inc., Class A(a) 6,137,99
6
Portfolio of Investments – as of December 31, 202
3
Vaughan Nelson Mid Cap Fund
S
ee accompanying notes to financial statements.
43
|

Shares Description Value (†)
Trading Companies & Distributors — 2.2
%
33,225 SiteOne Landscape Supply, Inc.(a) $ 5,399,063
Total
C
ommon
S
tock
s
(Identified Cost
$
194,166,623) 247,520,222
P
r
i
nc
ip
a
l
A
moun
t
S
hort-Term Investments — 0.7
%
$
1,751,872 Tri-Party Repurchase Agreement with Fixed Incom
e
Clearing Corporation, dated 12/29/2023 at 2.500
%
t
o
be repurchased at
$
1,752,359 on 1/02/202
4
collateralized by $1,998,000 U.S. Treasury Note
,
0.500% due 4/30/2027 valued at
$
1,786,942 including
accrued interest (Note 2 of Notes to Financia
l
Statements
)
(Identified Cost
$
1,751,872) 1,751,872
Total Investments — 99.4
%
(Identified Cost $195,918,495) 249,272,094
Other assets less liabilities — 0.6% 1,382,155
Net Assets — 100.0%
$
250,654,24
9
(†) See Note 2 of Notes to Financial Statements.
(a) Non-income producing security.
REITs Real Estate Investment Trusts
Industry Summary at December 31, 2023
Semiconductors & Semiconductor Equipment 7.9
%
B
an
k
s7.
7
Life
S
ciences Tools
&
S
ervices 6.
5
Capital Markets 6.1
Professional
S
ervices 5.3
El
ectr
i
ca
l
E
qu
i
pment 5.
1
S
pecialty Retail 4.
6
S
pecialized REITs 4.2
I
nsurance 4.0
Oil, Gas & Consumable Fuels 4.0
I
n
d
ustr
i
a
l
REIT
s3.
4
Metals & Mining 2.
7
Textiles, Apparel & Luxury Goods 2.
4
Construction Materials 2.
4
M
ac
hi
nery 2.
4
Electronic Equipment, Instruments & Components 2.4
IT Services
2.
3
Construction & Engineering 2.
3
C
ontainers
&
Packaging 2.2
Trading
C
ompanies
&
Distributors 2.
2
B
u
ildi
ng
P
ro
d
ucts 2.1
Energy Equipment
&
S
ervices 2.
0
Other Investments, less than 2
%
each 14.
5
S
hort-Term Investments 0.7
T
ota
l
I
nvestments 99.
4
O
ther assets less liabilities 0.
6
N
et Assets 100.0
%
Portfolio of Investments – as of December 31, 202
3
Vaughan Nelson Mid Cap Fund
(
continued
)
S
ee accompanying notes to financial statements.
|
4
4

Shares Description Value (†)
Common Stocks — 96.1% of Net Asset
s
Banks — 11.5
%
330,155 Cadence Bank $ 9,769,28
7
253,055 Comerica, Inc. 14,123,00
0
302,815 Old National Bancorp 5,114,545
147,025 Prosperity Bancshares, Inc. 9,958,003
245,585 United Bankshares, Inc. 9,221,717
222,490
W
estern
Alli
ance
B
ancorp 14,637,617
279,105 Zions Bancorp NA 12,244,336
7
5,
068
,5
05
Beverages — 1.3%
9,
380 Coca-Cola Consolidated, Inc. 8,708,39
2
B
u
ildi
ng
P
ro
d
ucts — 4.2%
66,080 AA
O
N, Inc. 4,881,33
0
74,080 Advanced Drainage Systems, Inc. 10,418,61
1
922,530 Janus International Group, Inc.(a) 12,039,01
6
2
7,
338
,
9
57
Capital Markets — 2.8
%
202,365 Artisan Partners Asset Management, Inc., Class A 8,940,486
162,465 Moelis & Co., Class A 9,119,160
18
,
0
5
9
,
6
4
6
Chemicals — 6.9
%
282,280 Axalta Coating Systems Ltd.(a) 9,589,05
1
297,805 Chemours Co. 9,392,770
963,045 Element
S
olutions, Inc. 22,284,86
1
241,725 Mativ Holdings, Inc. 3,700,810
4
4,967,49
2
C
onstruction
&
Engineering — 0.7%
20,705
V
a
l
mont
I
n
d
ustr
i
es,
I
nc. 4,834,82
5
Electronic Equipment, Instruments
&
C
omponents — 7.1%
90,970
Ad
vance
d
E
nergy
I
n
d
ustr
i
es,
I
nc. 9,908,452
68,520 Fabrinet(a) 13,041,41
2
131,230 Insight Enterprises, Inc.(a) 23,252,64
4
46
,
202
,5
08
Energy Equipment & Services — 0.9%
573,895 Patterson-UTI Energy, Inc. 6,198,066
Gas Utilities — 1.6
%
164,390 Spire, Inc. 10,248,07
3
Ground Transportation — 3.1%
59,780 Landstar System, Inc. 11,576,397
19,645
Saia, Inc.
(
a
)
8,608,83
2
20,185,22
9
Health Care Equipment & Supplies — 1.3%
158,320 Globus Medical, Inc., Class A
(
a
)
8,436,87
3
Health
C
are Providers
&
S
ervices — 1.7
%
66,795 Acadia Healthcare Co., Inc.(a) 5,193,97
9
6
1,490 Amedisys, Inc.
(
a
)
5,845,240
11,039,21
9
Hotels, Restaurants
&
Leisure — 2.6%
301,849 International Game Technology PLC 8,273,681
160,995 Red Rock Resorts, Inc.,
C
lass A 8,585,86
3
16,859,54
4
H
ouse
h
o
ld
D
ura
bl
es — 3.8%
78,475
I
nsta
ll
e
d
B
u
ildi
ng
P
ro
d
ucts,
I
nc. 14,346,799
143,265 Skyline Champion Corp.(a) 10,638,85
9
24,985,658
S
hares Description Value (†)
I
n
d
ustr
i
a
l
REIT
s — 1.8
%
3
00,810 STAG Industrial, Inc. $ 11,809,80
1
I
nsurance — 3.7
%
2
31,170 First American Financial Corp. 14,896,595
93,445 Selective Insurance Group, Inc. 9,295,90
8
2
4,1
92
,5
03
L
ife Sciences Tools & Services — 1.0
%
2
75,280 Avantor, Inc.(a) 6,284,642
M
achinery — 4.1
%
54,440 Alamo Group, Inc. 11,442,74
4
72,710 Federal
S
ignal
C
orp. 5,579,765
63,630 Franklin Electric
C
o., Inc. 6,149,840
16,265 Watts Water Technologies, Inc., Class A
3,388,65
0
26,560,999
M
ar
i
ne
T
ransportat
i
on — 1.9
%
154,345 Kirby Corp.(a) 12,112,996
Metals & Mining — 1.0%
51,590 Materion Corp. 6,713,407
Mortgage Real Estate Investment Trusts (REITs) — 3.1
%
845,830 AGNC Investment Corp. 8,297,592
595,665
MFA
Fi
nanc
i
a
l
,
I
nc. 6,713,14
5
338,125
P
enn
yM
ac
M
ortgage
I
nvestment
T
rust 5,054,969
20
,
06
5,7
06
Office REITs — 1.0%
350,315 Equity Commonwealth 6,726,04
8
O
il,
G
as
&
C
onsumable Fuels — 5.9%
157,030 Antero Resources Corp.(a) 3,561,44
0
49,935 Chord Energy Corp. 8,300,695
131,520
C
omstock Resources, Inc. 1,163,95
2
132,640 Matador Resources
C
o. 7,541,91
1
197,900 Murphy Oil Corp. 8,442,41
4
673,350 Permian Resources
C
orp. 9,157,56
0
38
,1
6
7,
9
7
2
P
ersonal
C
are Products — 0.7
%
382,805 Coty, Inc., Class A(a) 4,754,43
8
Professional
S
ervices — 2.9
%
102,225 ASGN, Inc.
(
a
)
9,830,97
8
133,095 K
f
orce, Inc. 8,991,89
8
1
8,822,876
Real Estate Management
&
Development — 0.3
%
174,020 Cushman & Wakefield PLC(a) 1,879,41
6
R
eta
il
REIT
s — 1.7%
251,520
NNN
REIT
,
I
nc. 10,840,512
S
emiconductors
&
S
emiconductor Equipment — 2.4%
168,105 Rambus, Inc.(a) 11,473,16
6
118,780 Ultra Clean Holdings, Inc.(a) 4,055,14
9
1
5,5
28
,
3
15
Sp
ecialized REITs — 1.6
%
256,635 National Storage Affiliates Trust 10,642,65
3
Sp
ecialty Retail — 4.5%
84,480 Academy Sports & Outdoors, Inc.
5,575,68
0
143,045
F
oot
L
oc
k
er,
I
nc. 4,455,85
2
12,080 Restoration Hardware, Inc.(a) 3,521,078
84,815
S
ignet Jewelers Ltd. 9,097,257
178,350 Valvoline, Inc.(a) 6,702,393
29
,
3
5
2
,
260
Portfolio of Investments – as of December 31, 202
3
Vaughan Nelson Small Cap Value Fund
S
ee accompanying notes to financial statements.
45
|

Shares Description Value (†)
Textiles, Apparel & Luxury Goods — 1.1
%
2
24,090 Gildan Activewear, Inc. $ 7,408,41
5
Trading
C
ompanies
&
Distributors — 7.9
%
142,630 Beacon Roofing Supply, Inc.(a) 12,411,662
357,565 Core & Main, Inc., Class A(a) 14,449,202
89,685
G
ATX
C
orp. 10,781,931
45,515 Mc
G
rath Rent
C
orp 5,444,504
169,142 Rush Enterprises, Inc., Class A
8,507,84
3
51,5
9
5,14
2
Total
C
ommon
S
tocks
(Identified Cost $524,545,604) 626,591,08
8
P
r
i
nc
ip
a
l
A
mount
Short-Term Investments — 3.4%
$
22,593,629 Tri-Party Repurchase Agreement with Fixe
d
Income
C
learing
C
orporation, dated 12/29/2023 a
t
2.500% to be repurchased at $22,599,905 on
1/02/2024 collateralized by
$
22,635,60
0
U.S. Treasury Note, 4.125% due 9/30/2027 valued at
$
23,045,580 including accrued interest (Note 2 of
Notes to Financial Statements)
(Identified Cost
$
22,593,629) 22,593,629
Total Investments — 99.5
%
(Identified Cost
$
547,139,233) 649,184,71
7
Other assets less liabilities — 0.5
%
2,947,482
Net Assets — 100.0% $652,132,19
9
(†) See Note 2 of Notes to Financial Statements.
(a) Non-income producing security.
REITs Real Estate Investment Trusts
Industry Summary at December 31, 2023
Banks 11.5%
T
rading Companies & Distributors 7.9
E
lectronic Equipment, Instruments
&
C
omponents 7.1
C
hemicals 6.
9
O
il,
G
as
&
C
onsumable Fuels 5.9
Sp
ecialty Retail 4.
5
Building Products 4.2
M
ac
hi
nery 4.
1
H
ouse
h
o
ld
D
ura
bl
es 3.
8
I
nsurance 3.7
G
round Transportation 3.1
M
ortgage Real Estate Investment Trusts (REITs) 3.
1
Professional Services 2.9
C
apital Markets 2.
8
H
otels, Restaurants & Leisure 2.
6
S
emiconductors & Semiconductor Equipment 2.4
O
ther Investments, less than 2% each 19.6
S
hort-Term Investments 3.4
T
ota
l
I
nvestments 99.
5
O
ther assets less liabilities 0.5
N
et Assets 100.0%
Portfolio of Investments – as of December 31, 202
3
Vaughan Nelson Small Cap Value Fund (continued)
S
ee accompanying notes to financial statements.
|
46

Loo
m
is
S
ayle
s
I
nternational
Growth Fun
d
Na
tixis
O
akmar
k
Fun
d
Na
t
i
x
is
O
akmark
International
Fu
nd
Na
tixis
U.
S
.
Eq
uit
y
O
pportunities
Fu
n
d
A
SS
ET
S
Investments at cost $30,861,766 $552,842,890 $ 352,265,085 $649,527,243
Net unrealized appreciation (depreciation) (403,550) 82,938,443 31,132,251 314,675,246
I
nvestments at va
l
ue 30,458,216 635,781,333 383,397,336 964,202,489
C
as
h
———1
0
,
827
Foreign currency at value (identified cost
$
45,561,
$
0,
$
836,111 and
$
51,248, respectively) 46,094 — 834,305 51,811
Receivable
f
or Fund shares sold — 5,092,103 920,281 1,759,29
7
Receivable
f
or securities sold 163,098 — 425,425 —
Di
v
id
en
d
s an
d
i
nterest rece
i
va
bl
e 58,903 477,207 73,935 498,07
4
T
ax rec
l
a
i
ms rece
i
va
bl
e 79,077 — 4,399,338 411,21
3
Prepaid expenses
(
Note 7
)
597 680 681 776
TO
TAL ASSET
S
30,805,985 641,351,323 390,051,301 966,934,48
7
LIABILITIE
S
Payable
f
or securities purchased — 644,667 594,400 —
Payable
f
or Fund shares redeemed — 1,807,541 222,875 176,260
Foreign taxes payable
(
Note 2
)
— — 107,255 —
Management fees payable
(
Note 5
)
12,426 246,860 127,696 539,376
Deferred Trustees’ fees
(
Note 5
)
9,775 1,024,399 142,334 556,155
Administrative fees payable
(
Note 5
)
1,177 23,739 14,832 36,94
9
Payable to distributor
(
Note 5d
)
40 2,925 6,453 3,64
2
Audit and tax services
f
ees payable 46,162 44,839 46,166 45,69
2
Other accounts payable and accrued expenses 12,393 64,718 156,972 115,14
1
TO
TAL LIABILITIE
S
81,973 3,859,688 1,418,983 1,473,215
COMMITMENTS AND CONTINGENCIES(a
)
————
NET ASSET
S
$
30,724,012
$
637,491,635
$
388,632,318
$
965,461,272
NET A
SS
ET
S
CO
N
S
I
S
T
O
F
:
P
a
id
-
i
n cap
i
ta
l
$
31,676,318
$
556,982,038
$
501,942,152
$
676,466,555
Accumulated earnings
(
loss
)(
952,306
)
80,509,597
(
113,309,834
)
288,994,71
7
NET A
SS
ET
S
$
30,724,012 $637,491,635 $ 388,632,318 $965,461,272
Statements of Assets and Liabilities
December 31, 2023
S
ee accompanying notes to financial statements.47
|

Loo
m
is
S
ayles
I
nternational
Growth Fun
d
Na
t
i
x
is
O
akmar
k
Fun
d
Na
t
i
x
is
O
akmark
I
nternational
Fund
Na
t
i
x
is
U.
S.
Eq
u
i
ty
O
pportunitie
s
Fun
d
CO
MPUTATI
O
N
O
F NET A
SS
ET VALUE AND
O
FFERIN
G
PRI
C
E:
C
lass A shares
:
N
et asset
s
$
151,029
$
257,097,523
$
142,825,208
$
612,652,91
3
Shares of beneficial interest 16,025 9,438,008 9,758,815 16,678,30
0
Net asset value and redemption price per share
$
9.42
$
27.24
$
14.64
$
36.73
Offering price per share (100/94.25 of net asset value) (Note 1)
$
9.99
$
28.90
$
15.53
$
38.97
Class C shares: (redemption price per share is equal to net asset value less an
y
applicable contingent deferred sales charge
)
(
Note 1
)
N
et asset
s
$
943
$
55,880,350
$
28,597,569
$
30,479,09
2
S
hares of beneficial interest 101 2,670,897 1,983,627 2,256,874
Net asset value and offering price per share $
9.29* $ 20.92 $ 14.42 $ 13.51
C
lass N shares
:
Net asset
s
$
25,660,904 $ 646,858 $ 347,798 $ 223,74
0
S
hares of beneficial interest 2,719,459 21,830 23,873 4,59
4
Net asset value, offering and redemption price per share
$
9.44
$
29.63
$
14.57
$
48.71*
C
lass Y shares:
N
et asset
s
$
4,911,136
$
323,866,904
$
216,861,743
$
322,105,52
7
Shares of beneficial interest 520,516 10,966,619 14,894,215 6,635,618
Net asset value, offering and redemption price per share $ 9.44 $ 29.53 $ 14.56 $ 48.54
* Net asset value calculations have been determined utilizing fractional share and penny amounts.
(a) As disclosed in the Notes to Financial Statements, if applicable.
S
tatements of Assets and Liabilities (continued)
D
ecember 31, 202
3
S
ee accompanying notes to financial statements.
|
4
8

V
au
gh
a
n
Nelso
n
Mid
C
ap Fund
V
au
gh
a
n
Nelson
S
mall Ca
p
Value Fun
d
A
SS
ET
S
I
nvestments at cost
$
195,918,495
$
547,139,23
3
N
et unrea
li
ze
d
apprec
i
at
i
on 53,353,599 102,045,48
4
I
nvestments at va
l
u
e
2
4
9
,
2
7
2
,
09
4
6
4
9
,1
8
4,717
Cas
h
1
822
Receivable
f
or Fund shares sold
36
,
99
57,
86
7,
698
Receivable
f
or securities sold 1,
608
,
96
7
—
Di
v
id
en
d
s an
d
i
nterest rece
i
va
bl
e
296
,
332
1,11
6
,4
83
P
repaid expenses
(
Note 7
)
6
51
6
4
2
T
O
TAL A
SS
ET
S
2
51,215,057 658,169,56
2
LIABILITIE
S
P
ayable
f
or securities purchase
d
— 4,
8
1
0
,71
8
P
ayable
f
or Fund shares redeemed 41,5
00
4
69
,
3
4
2
Management fees payable
(
Note 5
)
114,
069 39
1,1
04
D
eferred Trustees’ fees
(
Note 5
)
309
,1
2
5
2
44,
8
4
0
Administrative fees payable
(
Note 5
)
9
,
6
4
023
,4
00
P
ayable to distributor
(
Note 5d
)
1
,
636 3
,5
60
Audit and tax services
f
ees payable 45,
820
44,
8
5
3
O
ther accounts payable and accrued expense
s
39
,
0
1
8
4
9
,54
6
T
O
TAL LIABILITIE
S
560,808 6,037,363
COMMITMENTS AND CONTINGENCIES(a)
——
N
ET A
SS
ET
S
$
250,654,249
$
652,132,19
9
N
ET A
SS
ET
S
CO
N
S
I
S
T
O
F:
P
a
id
-
i
n cap
i
ta
l
$
203,132,962
$
562,435,07
0
A
ccumu
l
ate
d
earn
i
ng
s
4
7,5
2
1,
28
7
89
,
69
7,1
29
N
ET A
SS
ET
S
$
250,654,249 $652,132,19
9
CO
MPUTATION OF NET ASSET VALUE AND OFFERING PRICE
:
Class A shares
:
Net asset
s
$ 38,863,910 $111,267,65
1
S
hares of beneficial interest 1,707,633 5,892,67
2
N
et asset va
l
ue an
d
re
d
empt
i
on pr
i
ce per s
h
are
$
22.76
$
18.8
8
Offering price per share (100/94.25 of net asset value) (Note 1)
$
24.15
$
20.03
Class C shares:
(
redemption price per share is equal to net asset value less any applicable contingent deferred sales charge
)
(
Note 1
)
N
et assets
$
3,650,295
$
7,987,88
2
S
hares of beneficial interest 17
8
,
2
7
9
1,
226
,
6
1
4
Net asset value and o
ff
ering price per share
$
20.48
$
6.5
1
C
lass N shares:
N
et assets
$
63,893,516
$
2,505,67
3
Shares of beneficial interest
2
,7
63
,
09
41
2
4,4
28
Net asset value, offering and redemption price per share $ 23.12 $ 20.14
Class Y shares
:
N
et assets
$
144,246,528 $530,370,99
3
S
hares of beneficial interest 6,225,637 26,372,63
7
Net asset value, offering and redemption price per share $ 23.17 $ 20.11
(a) As disclosed in the Notes to Financial Statements, if applicable.
Statements of Assets and Liabilities (continued
)
D
ecember 31, 2023
S
ee accompanying notes to financial statements.
4
9
|

Loo
m
is
S
ayles
I
nternational
Growth Fun
d
Na
tixis
O
akmar
k
Fun
d
Na
t
i
x
is
O
akmark
International
Fu
nd
Na
tixi
s
U.
S.
Eq
uity
Opportunitie
s
Fu
n
d
INVE
S
TMENT IN
CO
M
E
Di
v
id
en
ds
$
407,463 $ 7,869,918 $12,142,241 $ 9,737,32
7
I
nterest 15,
960 636
,
2
7
9 289
,7
0
45
6
1,
8
7
3
Tax reclaims (Note 2e) — — 383,108
—
Less net foreign taxes withheld (51,017) (25,171) (1,335,640) (72,221)
3
7
2
,4
06 8
,4
8
1,
026
11,47
9
,41
3
1
0
,
226
,
9
7
9
E
xpense
s
Management fees (Note 5) 214,448 3,011,450 3,024,746 5,769,710
Service and distribution fees (Note 5) 356 1,069,144 695,561 1,708,637
Administrative fees (Note 5) 13
,245 207,874 177,532 390,705
Trustees' fees and ex
penses (Note 5) 18,036 101,358 42,439 94,135
Transfer agent fees and expenses (Notes 5 and 6) 8,230 371,693 656,349 568,282
Audit and tax services fees 46,174 44,918 46,287 45,96
2
Custodian fees and expenses 11,147 17,776 99,509 37,819
Le
gal
f
ee
s
1
,073 15,099 13,884 29,104
Registration
f
ees
7
2,710 169,767 84,515 94,08
0
Shareholder reporting expenses 3,488 45,344 52,604 56,010
Tax reclaim
professional fees (Note 2e) — — 56,292 —
Mi
sce
ll
aneous expenses 39,265 45,249 58,391 62,18
8
T
ota
l
expense
s
428
,17
2
5,
099
,
6
7
2
5,
008
,1
09 8
,
8
5
6
,
632
Less waiver and/or expense reimbursement (Note 5) (168,153) (439,690) (862,983) (1,225
)
Net expenses
2
60,019 4,659,982 4,145,126 8,855,407
N
et
i
nvestment
i
ncome 112,387 3,821,044 7,334,287 1,371,57
2
NET REALIZED AND UNREALIZED GAIN
(
LOSS
)
ON INVESTMENTS AND FOREIG
N
C
URRENCY TRANSACTION
S
Net realized gain
(
loss
)
on
:
I
nvestment
s
1
75,783 27,353,836
(
7,735,040
)
50,772,729
Foreign currency transactions
(
Note 2c
)
(
356
)
—
(
110,426
)(
4,268
)
Net change in unrealized appreciation
(
depreciation
)
on
:
I
nvestment
s
4
,
9
7
3
,1
88 89
,7
89
,474
6
5,
89
5,
03
4
2
11,74
6
,5
63
Foreign currency translations
(
Note 2c
)
6,008 — 216,425 7,060
Net realized and unrealized
gain on investments and
f
oreign currency transactions 5,154,623 117,143,310 58,265,993 262,522,084
NET IN
CREASE IN NET ASSETS RESULTING FROM OPERATION
S
$
5,267,010
$
120,964,354
$
65,600,280
$
263,893,656
Statements of Operations
For the Year Ended December 31, 2023
S
ee accompanying notes to financial statements.
|
5
0

Vaughan
Nelson
Mid
Cap Fund
Vaughan
Nelson
Small Cap
Value Fund
INVESTMENT INCOME
Dividends $ 3,203,592 $ 6,047,298
Interest 269,434521,605
3,473,026 6,568,903
Expenses
Management fees (Note 5) 1,868,542 2,975,008
Service and distribution fees (Note 5) 143,949 255,499
Administrative fees (Note 5) 115,399 162,073
Trustees' fees and expenses (Note 5) 46,293 49,765
Transfer agent fees and expenses (Notes 5 and 6) 185,733 383,891
Audit and tax services fees 45,834 44,901
Custodian fees and expenses 14,282 30,986
Legal fees 9,464 10,527
Registration fees 66,334 169,176
Shareholder reporting expenses 25,070 38,344
Miscellaneous expenses 38,654 41,281
Total expenses 2,559,554 4,161,451
Less waiver and/or expense reimbursement (Note 5) (205,610)
(405,973)
Net
expenses 2,353,944 3,755,478
Net investment income 1,119,082 2,813,425
NET REALIZED AND UNREALIZED GAIN (LOSS) ON INVESTMENTS
Net realized gain (loss) on:
Investments 19,749,361 (9,629,084)
Net change in unrealized appreciation (depreciation) on:
Investments 16,342,125 96,818,512
Net realized and unrealized gain on investments 36,091,486 87,189,428
NET INCREASE IN NET ASSETS RESULTING FROM OPERATIONS $37,210,568 $90,002,853
S
tatements of Operations (continued)
F
or the Year EndedDecember 31, 2023
S
ee accompanying notes to financial statements.
51
|

Loomis
S
ayle
s
I
nternational
G
rowth Fund Natixis
O
akmark Fun
d
Yea
r
E
n
ded
D
ecem
b
er 31
,
2023
Yea
r
E
n
ded
D
ecem
b
er 31
,
2022
Yea
r
E
n
ded
D
ecem
b
er 31
,
2023
Yea
r
E
n
ded
D
ecem
b
er 31
,
2022
F
R
O
M
O
PERATI
O
N
S:
Net investment income
$
112,387
$
132,158
$
3,821,044
$
2,868,356
Net realized
gain (loss) on investments and foreign currency transactions 175,427 (90,706) 27,353,836 42,131,98
1
Net change in unrealized appreciation (depreciation) on investments and foreign
currency translations 4,979,196
(
4,318,331
)
89,789,474
(
116,959,779
)
Net increase (decrease) in net assets resulting from operations 5,267,010 (4,276,879) 120,964,354 (71,959,442)
F
R
O
M DI
S
TRIBUTI
O
N
S
T
O
S
HAREH
O
LDER
S:
C
lass A
(
506
)(
565
)(
8,928,576
)(
28,746,130
)
Class
C
——
(
2,146,898
)(
9,213,071
)
C
lass N
(
157,071
)(
155,851
)(
22,322
)(
73,284
)
C
lass Y
(
27,691
)(
21,469
)(
11,189,568
)(
15,943,567
)
Total distributions (185,268) (177,885) (22,287,364) (53,976,052)
N
ET INCREASE IN NET ASSETS FROM CAPITAL
SHARES TRANSACTIONS
(
NOTE 10
)
1,
06
1,444 5,7
09
,
899
1
90
,
3
47,
088
1
02
,
236
,
626
Net increase (decrease) in net assets 6,143,186 1,255,135 289,024,078 (23,698,868)
N
ET ASSET
S
B
eginning o
f
the year 24,580,826 23,325,691 348,467,557 372,166,425
End of the
year $30,724,012 $24,580,826 $637,491,635 $ 348,467,557
Statements of Changes in Net Assets
S
ee accompanying notes to financial statements.
|
52

Natixis Oakmark International Fund Natixis U.S. Equity Opportunities Fund
Year Ended
December 31,2023
Year Ended
December 31,2022
Year Ended
December 31,2023
Year Ended
December 31,2022
FROM OPERATIONS:
Net investment income $ 7,334,287 $ 6,273,158 $ 1,371,572 $ 1,128,941
Net realized gain (loss) on investments, forward foreign currency contracts and
foreign currency transactions (7,845,466) (25,614,988) 50,768,461 79,629,441
Net change in unrealized appreciation (depreciation) on investments, forward
foreign currency contracts and foreign currency translations 66,111,459 (63,395,171) 211,753,623 (306,110,093)
Net increase (decrease) in net assets resulting from operations 65,600,280 (82,737,001) 263,893,656 (225,351,711)
FROM DISTRIBUTIONS TO SHAREHOLDERS:
Class A (2,424,146)(2,112,696)(46,461,965)(85,070,822)
Class C (211,014)(316,972)(5,579,179)(10,955,220)
Class N (6,886)(4,576)(13,778)(20,693)
Class Y (4,204,232)(4,025,613)(19,320,721)(26,488,550)
Total distributions (6,846,278) (6,459,857) (71,375,643) (122,535,285)
NET INCREASE (DECREASE) IN NET ASSETS FROM CAPITAL
SHARES TRANSACTIONS (NOTE 10) (30,035,491) (86,758,283) 39,116,768 5,882,691
Net increase (decrease) in net assets 28,718,511 (175,955,141) 231,634,781 (342,004,305)
NET ASSETS
Beginning of the year 359,913,807 535,868,948 733,826,491 1,075,830,796
End of the year $388,632,318 $ 359,913,807 $965,461,272 $ 733,826,491
S
tatements of Changes in Net Assets (continued)
S
ee accompanying notes to financial statements.5
3
|

Vaughan Nelson Mid Cap Fund Vaughan Nelson Small Cap Value Fund
Year Ended
December 31,2023
Year Ended
December 31,2022
Year Ended
December 31,2023
Year Ended
December 31,2022
FROM OPERATIONS:
Net investment income $ 1,119,082 $ 2,267,209 $ 2,813,425 $
82,819
Net realized gain (loss) on investments 19,749,361 (21,324,989)(9,629,084) 4,298,905
Net change in unrealized appreciation (depreciation) on investments 16,342,125 (18,052,025) 96,818,512 (19,344,302)
Net
increase (decrease)
in net assets resulting from operations 37,210,568 (37,109,805) 90,002,853 (14,962,578)
FRO
M DIS
TRIBUTIONS TO SHAREHOLDERS:
Class A (125,295)(1,087,431)(318,831)(3,939,067)
Class C — (262,976)(67,551)
(240,247)
Class N (367,799)(2,652,401)(12,034)(77,738)
Class Y (766,274)(5,985,855)(2,375,163)(5,400,412)
Total distributions (1,259,368) (9,988,663) (2,773,579) (9,657,464)
NET
INCREASE (DECREASE)
IN NET ASSETS FROM CAPITAL
SHARES TRANSACTIONS (NOTE 10) (47,517,639) (58,219,497) 374,368,392 65,258,561
Net increase (decrease) in net assets (11,566,439) (105,317,965) 461,597,666 40,638,519
NET ASSETS
Beginning of the year 262,220,688 367,538,653 190,534,533 149,896,014
End of the year $250,654,249 $ 262,220,688 $652,132,199 $190,534,533
S
tatements of Changes in Net Assets (continued)
S
ee accompanying notes to financial statements.
|
5
4

Loomis Sayles International Growth Fund—Class A
Year
Ended
December 31,
2023
Year Ended
December 31,
2022
Year Ended
December 31,
2021
Period Ended
December 31,
2020*
Net asset value, beginning of the period $ 7.84 $ 9.57 $10.13 $10.00
INCOME (LOSS) FROM INVESTMENT OPERATIONS:
Net investment income (loss)(a) 0.01 0.02 (0.01) 0.01
Net
realized and unrealized gain (loss) 1.60 (1.71) (0.41) 0.13
Total from Investment Operations 1.61 (1.69)(0.42) 0.14
LESS DISTRIBUTIONS FROM:
Net investment income (0.03) (0.04) (0.01) (0.01)
Net realized capital gains — — (0.13) —
Total Distributions (0.03)(0.04)(0.14)(0.01)
Net asset value, end of the period $ 9.42 $ 7.84 $ 9.57 $10.13
Total return(b)(c) 20.56% (17.71)% (4.07)% 1.37%(d)
RATIOS TO AVERAGE NET ASSETS:
Net assets, end of the period (000's) $ 151 $ 125 $ 113 $ 1
Net expenses(e) 1.20% 1.20% 1.20% 1.20%(f)
Gross expenses 1.87% 2.05% 2.71% 13.05%(f)
Net investment income (loss) 0.12% 0.26% (0.07)% 1.28%(f)
Portfolio turnover rate 5% 11% 9% 1%
* From
commencement of operations on December 15, 2020 through December 31, 2020.
(a) Per share
net investment income (loss) has been calculated using the average shares outstanding during the period.
(b) A sales charge for Class A shares is not reflected in total return calculations.
(c) Had certain expenses not been waived/reimbursed during the period, total returns would have been lower.
(d) Periods less than one year are not annualized.
(e) The investment adviser agreed to waive its fees and/or reimburse a portion of the Fund’s expenses during the period. Without this waiver/reimbursement, expenses
would have been higher.
(f) Computed on an annualized basis for periods less than one year.
Financial Highlights
For a share outstanding throughout each period.
S
ee accompanying notes to financial statements.
55
|

Loomis Sayles International Growth Fund—Class C
Year Ended
December 31,
2023
Year Ended
December 31,
2022
Year Ended
December 31,
2021
Period Ended
December 31,
2020*
Net asset value, beginning of the period $ 7.77 $ 9.51 $10.13 $10.00
INCOME (LOSS) FROM INVESTMENT OPERATIONS:
Net investment income (loss)(a) (0.06) 0.02 (0.09) 0.00(b)
Net realized and unrealized gain (loss) 1.58 (1.76) (0.40) 0.13
Total from Investment Operations 1.52 (1.74)(0.49) 0.13
LESS DISTRIBUTIONS FROM:
Net investment income — — (0.00)(b) (0.00)(b)
Net realized capital gains — — (0.13) —
Total Distributions ——(0.13)(0.00)
Net asset value, end of the period $ 9.29 $ 7.77 $ 9.51 $10.13
Total return(c)(d) 19.56% (18.30)% (4.79)% 1.33%(e)
RATIOS TO AVERAGE NET ASSETS:
Net assets, end of the period (000's) $ 1 $ 1 $ 38 $ 1
Net expenses(f) 1.95% 1.95% 1.95% 1.95%(g)
Gross expenses 2.53% 2.79% 3.46% 13.78%(g)
Net investment income (loss) (0.68)% 0.21% (0.90)% 0.55%(g)
Portfolio turnover rate 5% 11% 9% 1%
* From commencement of operations on December 15, 2020 through December 31, 2020.
(a) Per share net investment income (loss) has been calculated using the average shares outstanding during the period.
(b) Amount rounds to less than $0.01 per share.
(c)
A contingent deferred sales charge for Class C shares is not reflected in total return calculations.
(d) Had certain expenses not been waived/reimbursed during the period, total returns would have been lower.
(e) Periods less than one year are not annualized.
(f) The investment adviser agreed to waive its fees and/or reimburse a portion of the Fund’s expenses during the period. Without this waiver/reimbursement, expenses
would have been higher.
(g) Computed on an annualized basis for periods less than one year.
Financial Highlights (continued)
F
or a share outstanding throughout eachperiod.
S
ee accompanying notes to financial statements.
|
56

L
oomis Sayles International Growth Fund—Class N
Yea
r
E
n
ded
December 31
,
2023
Yea
r
E
n
ded
D
ecember 31
,
2022
Yea
r
E
n
ded
D
ecember 31,
2021
Pe
r
iod
E
n
ded
D
ecember 31
,
2020*
Net asset value, beginning of the period $ 7.85 $ 9.58 $ 10.13 $ 10.0
0
INCOME (LOSS) FROM INVESTMENT OPERATIONS
:
Net investment income(a) 0.04 0.05 0.03 0.0
1
Net realized and unrealized gain (loss) 1.61 (1.72) (0.42) 0.13
Total from Investment Operations 1.65
(
1.67
)(
0.39
)
0.14
LESS DISTRIBUTIONS FROM
:
Net investment income (0.06) (0.06) (0.03) (0.01
)
Net realized capital gains — — (0.13)
—
Total Distributions
(
0.06
)(
0.06
)(
0.16
)(
0.01
)
Net asset value, end of the period $ 9.44 $ 7.85 $ 9.58 $ 10.1
3
Total return
(
b
)
20.99
%
(17.47)
%
(3.77)
%
1.38
%
(c
)
RATI
OS
T
O
AVERA
G
E NET A
SS
ET
S
:
Net assets, end of the period (000's)
$
25,661
$
21,331
$
22,953
$
15,20
6
Net expenses
(
d
)
0.90
%
0.90
%
0.90
%
0.90
%
(e
)
G
ross expense
s
1.47
%
1.67
%
1.58
%
6.48
%
(e
)
Net investment income 0.41
%
0.62
%
0.29
%
1.43
%
(e
)
Port
f
olio turnover rate 5
%
11
%
9
%
1
%
* From commencement of operations on December 15, 2020 through December 31, 2020.
(a) Per share net investment income has been calculated using the average shares outstanding during the period.
(b) Had certain expenses not been waived/reimbursed during the period, total returns would have been lower.
(c) Periods less than one year are not annualized.
(d) The investment adviser agreed to waive its fees and/or reimburse a portion of the Fund’s expenses during the period. Without this waiver/reimbursement, expenses
would have been higher.
(e) Computed on an annualized basis for periods less than one year.
Financial Highlights (continued)
F
or a share outstanding throughout eachperiod.
S
ee accompanying notes to financial statements.
57
|

L
oomis Sayles International Growth Fund—Class Y
Yea
r
E
n
ded
December 31
,
2023
Yea
r
E
n
ded
D
ecember 31
,
2022
Yea
r
E
n
ded
D
ecember 31,
2021
Pe
r
iod
E
n
ded
D
ecember 31
,
2020*
Net asset value, beginning of the period $ 7.85 $ 9.58 $10.13 $10.00
INCOME (LOSS) FROM INVESTMENT OPERATIONS
:
Net investment income(a) 0.03 0.04 0.02 0.0
1
Net realized and unrealized gain (loss) 1.61 (1.72) (0.41) 0.13
Total from Investment Operations 1.64
(
1.68
)(
0.39
)
0.14
LESS DISTRIBUTIONS FROM
:
Net investment income (0.05) (0.05) (0.03) (0.01)
Net realized capital gains — — (0.13)
—
Total Distributions
(
0.05
)(
0.05
)(
0.16
)(
0.01
)
Net asset value, end of the period $ 9.44 $ 7.85 $ 9.58 $10.1
3
Total return
(
b
)
2
0.81
%
(17.50)
%
(3.81)
%
1.38
%
(c)
RATI
OS
T
O
AVERA
G
E NET A
SS
ET
S
:
Net assets, end of the period (000's)
$
4,911
$
3,124
$
222
$
12
Net expenses
(
d
)
0.95
%
0.95
%
0.95
%
0.95
%
(e
)
G
ross expense
s
1.62
%
1.80
%
2.46
%
12.58
%
(e)
Net investment income 0.32
%
0.47
%
0.19
%
1.63
%
(e)
Port
f
olio turnover rate
5%
11
%
9
%
1
%
* From commencement of operations on December 15, 2020 through December 31, 2020.
(a) Per share net investment income has been calculated using the average shares outstanding during the period.
(b) Had certain expenses not been waived/reimbursed during the period, total returns would have been lower.
(c) Periods less than one year are not annualized.
(d) The investment adviser agreed to waive its fees and/or reimburse a portion of the Fund’s expenses during the period. Without this waiver/reimbursement, expenses
would have been higher.
(e) Computed on an annualized basis for periods less than one year.
Financial Highlights (continued)
F
or a share outstanding throughout eachperiod.
S
ee accompanying notes to financial statements.
|
58

N
atixis
O
akmark Fund—
C
lass
A
Yea
r
E
n
ded
D
ecember 31
,
2023
Yea
r
E
n
ded
D
ecember 31
,
2022
Yea
r
E
n
ded
D
ecember 31
,
2021
Yea
r
E
n
ded
December 31
,
2020
Yea
r
E
n
ded
D
ecember 31
,
20
1
9
N
et asset value, beginning of the period $ 21.55 $ 29.04 $ 23.20 $ 22.45 $ 19.44
INCOME (LOSS) FROM INVESTMENT OPERATIONS
:
N
et investment income(a) 0.20 0.17 0.07 0.11(b) 0.18(c
)
N
et realized and unrealized gain (loss) 6.48 (4.00) 7.81 2.78 4.93
Total from Investment Operations 6.68
(
3.83
)
7.88 2.89 5.11
L
ESS DISTRIBUTIONS FROM
:
N
et investment income (0.16) (0.20) (0.05) (0.12) (0.21)
N
et realized capital gains (0.83) (3.46) (1.99) (2.02) (1.89)
Total Distributions
(
0.99
)(
3.66
)(
2.04
)(
2.14
)(
2.10
)
N
et asset value, end of the period $ 27.24 $ 21.55 $ 29.04 $ 23.20 $ 22.45
Total return(d) 30.96
%
(e) (13.30)
%
(e) 33.97
%
(e) 13.01
%
(b) 26.77
%
(c)
RATI
OS
T
O
AVERA
G
E NET A
SS
ET
S
:
N
et assets, end of the period (000's)
$
257,098
$
192,750
$
222,435
$
170,702
$
181,41
7
N
et expenses 1.05
%
(f) 1.05
%
(f) 1.12
%
(f)(g) 1.20
%
(h) 1.17
%
G
ross expenses 1.15
%
1.10
%
1.14
%
1.20
%
(h) 1.17
%
N
et investment income 0.81
%
0.65
%
0.25
%
0.53
%
(b) 0.85
%
(c)
Portfolio turnover rate 40
%
69
%
23
%
22
%
15
%
(a) Per share net investment income has been calculated using the average shares outstanding during the period.
(b) Includes a non-recurring dividend. Without this dividend, net investment income per share would have been $0.05, total return would have been 12.72% and the ratio
of net investment income to average net assets would have been 0.27%.
(c) Includes a non-recurring dividend. Without this dividend, net investment income per share would have been $0.13, total return would have been 26.50% and the ratio
of net investment income to average net assets would have been 0.62%.
(d) A sales charge for Class A shares is not reflected in total return calculations.
(e) Had certain expenses not been waived/reimbursed during the period, total returns would have been lower.
(f) The investment adviser agreed to waive its fees and/or reimburse a portion of the Fund’s expenses during the period. Without this waiver/reimbursement, expenses
would have been higher.
(g) Effective July 1, 2021, the expense limit decreased from 1.30% to 1.05%.
(h) Includes refund of prior year service fee of 0.01%.
Financial Highlights (continued)
F
or a share outstanding throughout eachperiod.
S
ee accompanying notes to financial statements.
5
9
|

N
atixis
O
akmark Fund—
C
lass
C
Yea
r
E
n
ded
D
ecember 31
,
2023
Yea
r
E
n
ded
D
ecember 31
,
2022
Yea
r
E
n
ded
D
ecember 31
,
2021
Yea
r
E
n
ded
December 31
,
2020
Yea
r
E
n
ded
D
ecember 31
,
20
1
9
N
et asset value, beginning of the period $ 16.74 $ 23.50 $ 19.17 $ 18.92 $ 16.66
INCOME (LOSS) FROM INVESTMENT OPERATIONS
:
N
et investment income (loss)(a) 0.01 (0.02) (0.12) (0.04)(b) 0.02(c)
N
et realized and unrealized gain (loss) 5.01 (3.23) 6.44 2.31 4.20
Total from Investment Operations 5.02
(
3.25
)
6.32 2.27 4.22
L
ESS DISTRIBUTIONS FROM
:
N
et investment income (0.01) (0.05) (0.00)(d) — (0.07)
N
et realized capital gains (0.83) (3.46) (1.99) (2.02) (1.89)
Total Distributions
(
0.84
)(
3.51
)(
1.99
)(
2.02
)(
1.96
)
N
et asset value, end of the period $ 20.92 $ 16.74 $ 23.50 $ 19.17 $ 18.92
Total return(e) 29.99
%
(f) (13.97)
%
(f) 32.99
%
(f) 12.15
%
(b) 25.82
%
(c)
RATI
OS
T
O
AVERA
G
E NET A
SS
ET
S
:
N
et assets, end of the period (000's)
$
55,880
$
51,987
$
50,042
$
35,940
$
54,38
4
N
et expenses 1.80
%
(g) 1.80
%
(g) 1.87
%
(g)(h) 1.95
%
1.92
%
Gross expenses 1.90
%
1.85
%
1.89
%
1.95
%
1.92
%
N
et investment income (loss) 0.05
%
(0.10)
%
(0.49)
%
(0.23)
%
(b) 0.12
%
(c)
Portfolio turnover rate 40
%
69
%
23
%
22
%
15
%
(a) Per share net investment income (loss) has been calculated using the average shares outstanding during the period.
(b) Includes a non-recurring dividend. Without this dividend, net investment loss per share would have been $(0.08), total return would have been 11.85% and the ratio of
net investment loss to average net assets would have been (0.46)%.
(c) Includes a non-recurring dividend. Without this dividend, net investment loss per share would have been $(0.02), total return would have been 25.50% and the ratio of
net investment loss to average net assets would have been (0.12)%.
(d) Amount rounds to less than $0.01 per share.
(e) A contingent deferred sales charge for Class C shares is not reflected in total return calculations.
(f) Had certain expenses not been waived/reimbursed during the period, total returns would have been lower.
(g) The investment adviser agreed to waive its fees and/or reimburse a portion of the Fund’s expenses during the period. Without this waiver/reimbursement, expenses
would have been higher.
(h) Effective July 1, 2021, the expense limit decreased from 2.05% to 1.80%.
Financial Highlights (continued)
F
or a share outstanding throughout eachperiod.
S
ee accompanying notes to financial statements.
|
60

N
atixis
O
akmark Fund—
C
lass
N
Yea
r
E
n
ded
D
ecember 31
,
2023
Yea
r
E
n
ded
D
ecember 31
,
2022
Yea
r
E
n
ded
December 31
,
202
1
Yea
r
E
n
ded
D
ecember 31
,
2020
Yea
r
E
n
ded
December 31
,
20
1
9
Net asset value, beginning of the period $23.36 $ 31.13 $24.72 $23.78 $20.49
INCOME (LOSS) FROM INVESTMENT OPERATIONS:
Net investment income(a) 0.30 0.26 0.23 0.18(b) 0.22(c
)
Net realized and unrealized gain (loss) 7.03 (4.29) 8.31 2.98 5.2
5
Total from Investment Operations 7.33
(
4.03
)
8.54 3.16 5.4
7
L
ESS DISTRIBUTIONS FROM
:
Net investment income (0.23) (0.28) (0.14) (0.20) (0.29
)
Net realized capital gains (0.83) (3.46) (1.99) (2.02) (1.89)
Total Distributions
(
1.06
)(
3.74
)(
2.13
)(
2.22
)(
2.18
)
Net asset value, end of the period $29.63 $ 23.36 $31.13 $24.72 $23.78
Total return(d) 31.35
%
(13.06)
%
34.54
%
13.41
%
(b) 27.16
%
(c
)
RATI
OS
T
O
AVERA
G
E NET A
SS
ET
S:
Net assets, end of the period (000's)
$
647
$
517
$
682
$
364
$
801
Net expenses(e) 0.75
%
0.75
%
0.80
%
(f) 0.86
%
0.83
%
Gross expenses 1.03
%
0.93
%
1.55
%
1.05
%
1.25
%
Net investment income 1.11
%
0.93
%
0.79
%
0.85
%
(b) 0.93
%
(c)
Portfolio turnover rate 40
%
69
%
23
%
22
%
15
%
(a) Per share net investment income has been calculated using the average shares outstanding during the period.
(b) Includes a non-recurring dividend. Without this dividend, net investment income per share would have been $0.14, total return would have been 13.13% and the ratio
of net investment income to average net assets would have been 0.67%.
(c) Includes a non-recurring dividend. Without this dividend, net investment income per share would have been $0.22, total return would have been 26.90% and the ratio
of net investment income to average net assets would have been 0.92%.
(d) Had certain expenses not been waived/reimbursed during the period, total returns would have been lower.
(e) The investment adviser agreed to waive its fees and/or reimburse a portion of the Fund’s expenses during the period. Without this waiver/reimbursement, expenses
would have been higher.
(f) Effective July 1, 2021, the expense limit decreased from 1.00% to 0.75%.
Financial Highlights (continued)
For a share outstanding throughout eachperiod.
S
ee accompanying notes to financial statements.
61
|

N
atixis
O
akmark Fund—
C
lass
Y
Yea
r
E
n
ded
D
ecember 31
,
2023
Yea
r
E
n
ded
December 31
,
2022
Yea
r
E
n
ded
D
ecember 31
,
2021
Yea
r
E
n
ded
December 31
,
2020
Yea
r
E
n
ded
D
ecember 31
,
20
1
9
Net asset value, beginning of the period $ 23.29 $ 31.04 $ 24.68 $ 23.75 $ 20.46
INCOME (LOSS) FROM INVESTMENT OPERATIONS
:
Net investment income(a) 0.31 0.25 0.17 0.17(b) 0.27(c
)
Net realized and unrealized gain (loss) 6.98 (4.28) 8.31 2.95 5.1
7
Total from Investment Operations 7.29
(
4.03
)
8.48 3.12 5.44
L
ESS DISTRIBUTIONS FROM
:
Net investment income (0.22) (0.26) (0.13) (0.17) (0.26)
Net realized capital gains (0.83) (3.46) (1.99) (2.02) (1.89
)
Total Distributions
(
1.05
)(
3.72
)(
2.12
)(
2.19
)(
2.15
)
Net asset value, end of the period $ 29.53 $ 23.29 $ 31.04 $ 24.68 $ 23.75
Total return 31.28
%
(d) (13.10)
%
(d) 34.35
%
(d) 13.28
%
(b) 27.06
%
(c)(d)
RATI
OS
T
O
AVERA
G
E NET A
SS
ET
S
:
Net assets, end of the period (000's)
$
323,867
$
103,213
$
99,008
$
37,595
$
46,836
Net expenses 0.80
%
(e) 0.80
%
(e) 0.86
%
(e)(f) 0.95
%
0.91
%
(e)
Gross expenses 0.90
%
0.85
%
0.89
%
0.95
%
0.92
%
Net investment income 1.13
%
0.89
%
0.56
%
0.79
%
(b) 1.16
%
(c)
Portfolio turnover rate 40
%
69
%
23
%
22
%
15
%
(a) Per share net investment income has been calculated using the average shares outstanding during the period.
(b) Includes a non-recurring dividend. Without this dividend, net investment income per share would have been $0.12, total return would have been 13.00% and the ratio
of net investment income to average net assets would have been 0.55%.
(c) Includes a non-recurring dividend. Without this dividend, net investment income per share would have been $0.20, total return would have been 26.80% and the ratio
of net investment income to average net assets would have been 0.90%.
(d) Had certain expenses not been waived/reimbursed during the period, total returns would have been lower.
(e) The investment adviser agreed to waive its fees and/or reimburse a portion of the Fund’s expenses during the period. Without this waiver/reimbursement, expenses
would have been higher.
(f) Effective July 1, 2021, the expense limit decreased from 1.05% to 0.80%.
Financial Highlights (continued)
F
or a share outstanding throughout eachperiod.
S
ee accompanying notes to financial statements.
|
6
2

Natixis
O
akmark International Fund—
C
lass A
Yea
r
E
n
ded
D
ecem
b
er 31,
2023
Yea
r
E
n
ded
D
ecem
b
er 31
,
2022
Yea
r
E
n
ded
D
ecem
b
er 31,
2021
Yea
r
E
n
ded
D
ecem
b
er 31
,
2020
Yea
r
E
n
ded
D
ecem
b
er 31
,
20
1
9
Net asset value, beginning of the period $ 12.52 $ 15.15 $ 14.15 $ 13.63 $ 11.2
9
INCOME (LOSS) FROM INVESTMENT OPERATIONS:
Net investment income (loss)(a) 0.26(b) 0.19 0.27(c) (0.00)(d) 0.37(e)
Net realized and unrealized gain (loss) 2.11 (2.60) 0.96 0.55(f) 2.38
Total from Investment Operations 2.37
(
2.41
)
1.23 0.55 2.75
LE
SS DISTRIBUTIONS FROM:
Net investment income (0.25) (0.22) (0.23) (0.03) (0.41)
Net asset value, end of the period
$
14.64
$
12.52
$
15.15
$
14.15
$
13.6
3
Total return(g) 18.94%(b)(h) (15.91)%(h) 8.73%(c)(h) 4.06%(h) 24.35%(e)
RATI
OS
T
O
AVERA
G
E NET A
SS
ET
S:
Net assets, end of the period (000's) $142,825 $120,316 $152,900 $131,630 $172,906
Net expenses 1.15%(i) 1.15%(i) 1.17%(i)(j) 1.29%(i)(k) 1.29%
Gross expenses 1.37% 1.38% 1.34% 1.36% 1.29
%
Net investment income (loss) 1.84%(b) 1.48% 1.73%(c) (0.03)% 2.91%(e)
Portfolio turnover rate 26% 33% 37% 63% 28
%
(a) Per share net investment income (loss) has been calculated using the average shares outstanding during the period.
(b) Includes tax reclaims. Without these, net investment income per share would have been $0.25, total return would have been 18.78% and the ratio of net investment
income to average net assets would have been 1.74%.
(c) Includes a non-recurring dividend and tax reclaims. Without these, net investment income per share would have been $0.13, total return would have been 7.74% and
the ratio of net investment income to average net assets would have been 0.84%.
(d) Amount rounds to less than $0.01 per share.
(e) Includes non-recurring dividends. Without this dividend, net investment income per share would have been $0.29, total return would have been 23.55% and the ratio
of net investment income to average net assets would have been 2.26%.
(f) The amount shown for a share outstanding does not correspond with the aggregate realized and unrealized gain (loss) on investments for the period due to the
timing of sales and redemptions of fund shares in relation to fluctuating market values of investments of the Fund.
(g) A sales charge for Class A shares is not reflected in total return calculations.
(h) Had certain expenses not been waived/reimbursed during the period, total returns would have been lower.
(i) The investment adviser agreed to waive its fees and/or reimburse a portion of the Fund’s expenses during the period. Without this waiver/reimbursement, expenses
would have been higher.
(j) Effective July 1, 2021, the expense limit decreased from 1.20% to 1.15%.
(k) Effective July 1, 2020, the expense limit decreased from 1.37% to 1.20%.
Financial Highlights (continued)
F
or a share outstanding throughout each period.
S
ee accompanying notes to financial statements.
63
|

Natixis
O
akmark International Fund—
C
lass
C
Yea
r
E
n
ded
D
ecem
b
er 31
,
2023
Yea
r
E
n
ded
D
ecem
b
er 31
,
2022
Yea
r
E
n
ded
D
ecem
b
er 31
,
2021
Yea
r
E
n
ded
D
ecem
b
er 31
,
2020
Yea
r
E
n
ded
D
ecem
b
er 31
,
20
1
9
N
et asset value, beginning of the period $ 12.31 $ 14.86 $ 13.85 $ 13.41 $ 11.1
1
INCOME (LOSS) FROM INVESTMENT OPERATIONS
:
N
et investment income (loss)(a) 0.16(b) 0.10 0.13(c) (0.08) 0.26(d
)
N
et realized and unrealized gain (loss) 2.06 (2.55) 0.97 0.52(e) 2.34
Total from Investment Operations 2.22
(
2.45
)
1.10 0.44 2.60
L
ESS DISTRIBUTIONS FROM
:
N
et investment income (0.11) (0.10) (0.09) — (0.30)
N
et asset value, end of the period
$
14.42
$
12.31
$
14.86
$
13.85
$
13.41
Total return(f) 18.01%(b)(
g) (16.50)%(g) 7.92%(c)(g) 3.28%(g) 23.44%(d)
RATI
OS
T
O
AVERA
G
E NET A
SS
ET
S
:
N
et assets, end of the period (000's) $28,598 $39,202 $69,335 $96,772 $179,533
N
et expenses 1.90%(h) 1.90%(h) 1.93%(h)(i) 2.05%(h)(j) 2.04
%
Gross expenses 2.12% 2.13% 2.09% 2.11% 2.04
%
N
et investment income (loss) 1.18%(b) 0.78% 0.85%(c) (0.76)% 2.09%(d)
Portfolio turnover rate 26% 33% 37% 63% 28
%
(a) Per share net investment income (loss) has been calculated using the average shares outstanding during the period.
(b) Includes tax reclaims. Without these, net investment income per share would have been $0.15, total return would have been 17.85% and the ratio of net investment
income to average net assets would have been 1.10%.
(c) Includes a non-recurring dividend and tax reclaims. Without these, net investment income per share would have been $0.02, total return would have been 6.98% and
the ratio of net investment income to average net assets would have been 0.13%.
(d) Includes non-recurring dividends. Without this dividend, net investment income per share would have been $0.18, total return would have been 22.63% and the ratio
of net investment income to average net assets would have been 1.43%.
(e) The amount shown for a share outstanding does not correspond with the aggregate realized and unrealized gain (loss) on investments for the period due to the
timing of sales and redemptions of fund shares in relation to fluctuating market values of investments of the Fund.
(f) A contingent deferred sales charge for Class C shares is not reflected in total return calculations.
(g) Had certain expenses not been waived/reimbursed during the period, total returns would have been lower.
(h) The investment adviser agreed to waive its fees and/or reimburse a portion of the Fund’s expenses during the period. Without this waiver/reimbursement, expenses
would have been higher.
(i) Effective July 1, 2021, the expense limit decreased from 1.95% to 1.90%.
(j) Effective July 1, 2020, the expense limit decreased from 2.12% to 1.95%.
Financial Highlights (continued)
F
or a share outstanding throughout each period.
S
ee accompanying notes to financial statements.
|
6
4

N
atixis
O
akmark International Fund—
C
lass N
Yea
r
E
n
ded
D
ecem
b
er 31
,
2023
Yea
r
E
n
ded
D
ecem
b
er 31,
2022
Yea
r
E
n
ded
D
ecem
b
er 31
,
202
1
Yea
r
E
n
ded
D
ecem
b
er 31
,
2020
Yea
r
E
n
ded
D
ecem
b
er 31
,
20
1
9
Net asset value, beginning of the period $12.46 $ 15.08 $14.09 $13.56 $11.25
INCOME (LOSS) FROM INVESTMENT OPERATIONS:
Net investment income(a) 0.29(b) 0.32 0.38(c) 0.04 0.33(d
)
Net realized and unrealized gain (loss) 2.11 (2.68) 0.89 0.56(e) 2.45
Total from Investment Operations 2.40
(
2.36
)
1.27 0.60 2.78
LESS DISTRIBUTIONS FROM
:
Net investment income (0.29) (0.26) (0.28) (0.07) (0.47
)
Net asset value, end of the period
$
14.57
$
12.46
$
15.08
$
14.09
$
13.56
Total return(f) 19.30%(b) (15.65)% 9.01%(c) 4.44% 24.75%(d)
R
ATI
OS
T
O
AVERA
G
E NET A
SS
ET
S:
Net assets, end of the period (000's) $ 348 $ 222 $ 704 $ 290 $ 811
Net expenses(g) 0.85% 0.85% 0.87%(h) 0.92%(i) 0.94%
Gross expenses 1.44% 1.01% 1.25% 1.17% 1.08
%
Net investment income 2.08%(b) 2.56% 2.49%(c) 0.37% 2.56%(d
)
Portfolio turnover rate 26% 33% 37% 63% 28
%
(a) Per share net investment income has been calculated using the average shares outstanding during the period.
(b) Includes tax reclaims. Without these, net investment income per share would have been $0.27, total return would have been 19.14% and the ratio of net investment
income to average net assets would have been 1.95%.
(c) Includes a non-recurring dividend and tax reclaims. Without these, net investment income per share would have been $0.11, total return would have been 8.09% and
the ratio of net investment income to average net assets would have been 0.70%.
(d) Includes non-recurring dividends. Without this dividend, net investment income per share would have been $0.27, total return would have been 23.94% and the ratio
of net investment income to average net assets would have been 2.15%.
(e) The amount shown for a share outstanding does not correspond with the aggregate realized and unrealized gain (loss) on investments for the period due to the
timing of sales and redemptions of fund shares in relation to fluctuating market values of investments of the Fund.
(f) Had certain expenses not been waived/reimbursed during the period, total returns would have been lower.
(g) The investment adviser agreed to waive its fees and/or reimburse a portion of the Fund’s expenses during the period. Without this waiver/reimbursement, expenses
would have been higher.
(h) Effective July 1, 2021, the expense limit decreased from 0.90% to 0.85%.
(i) Effective July 1, 2020, the expense limit decreased from 1.07% to 0.90%.
Financial Highlights (continued)
For a share outstanding throughout each period.
S
ee accompanying notes to financial statements.
65
|

N
atixis
O
akmark International Fund—
C
lass Y
Yea
r
E
n
ded
D
ecem
b
er 31,
2023
Yea
r
E
n
ded
D
ecem
b
er 31
,
2022
Yea
r
E
n
ded
D
ecem
b
er 31
,
2021
Yea
r
E
n
ded
D
ecem
b
er 31
,
2020
Yea
r
E
n
ded
D
ecem
b
er 31
,
20
1
9
Net asset value, beginning of the period $ 12.45 $ 15.07 $ 14.08 $ 13.56 $ 11.2
5
INCOME (LOSS) FROM INVESTMENT OPERATIONS:
Net investment income(a) 0.29(b) 0.22 0.30(c) 0.04 0.37(d
)
Net realized and unrealized gain (loss) 2.11 (2.58) 0.96 0.55(e) 2.40
Total from Investment Operations 2.40
(
2.36
)
1.26 0.59 2.77
LE
SS DISTRIBUTIONS FROM:
Net investment income (0.29) (0.26) (0.27) (0.07) (0.46)
Net asset value, end of the period
$
14.56
$
12.45
$
15.07
$
14.08
$
13.56
Total return 19.26%(b)(f) (15.71)%(f) 8.97%(c)(f) 4.32%(f) 24.64%(d)
RATI
OS
T
O
AVERA
G
E NET A
SS
ET
S:
Net assets, end of the period (000's) $216,862 $200,175 $312,930 $275,468 $244,586
Net expenses 0.90%(g) 0.90%(g) 0.92%(g)(h) 1.03%(g)(i) 1.04%
Gross expenses 1.12% 1.13% 1.09% 1.11% 1.04
%
Net investment income 2.08%(b) 1.66% 1.96%(c) 0.41% 2.91%(d)
Portfolio turnover rate 26% 33% 37% 63% 28
%
(a) Per share net investment income has been calculated using the average shares outstanding during the period.
(b) Includes tax reclaims. Without these, net investment income per share would have been $0.28, total return would have been 19.18% and the ratio of net investment
income to average net assets would have been 1.98%.
(c) Includes a non-recurring dividend and tax reclaims. Without these, net investment income per share would have been $0.17, total return would have been 8.04% and
the ratio of net investment income to average net assets would have been 1.07%.
(d) Includes non-recurring dividends. Without this dividend, net investment income per share would have been $0.29, total return would have been 23.84% and the ratio
of net investment income to average net assets would have been 2.29%.
(e) The amount shown for a share outstanding does not correspond with the aggregate realized and unrealized gain (loss) on investments for the period due to the
timing of sales and redemptions of fund shares in relation to fluctuating market values of investments of the Fund.
(f) Had certain expenses not been waived/reimbursed during the period, total returns would have been lower.
(g) The investment adviser agreed to waive its fees and/or reimburse a portion of the Fund’s expenses during the period. Without this waiver/reimbursement, expenses
would have been higher.
(h) Effective July 1, 2021, the expense limit decreased from 0.95% to 0.90%.
(i) Effective July 1, 2020, the expense limit decreased from 1.12% to 0.95%.
Financial Highlights (continued)
F
or a share outstanding throughout each period.
S
ee accompanying notes to financial statements.
|
66

N
atixis U.S. Equity Opportunities Fund—Class A
Yea
r
E
n
ded
D
ecember 31
,
2023
Yea
r
E
n
ded
D
ecember 31,
2022
Yea
r
E
n
ded
D
ecember 31
,
2021
Yea
r
E
n
ded
D
ecember 31,
2020
Yea
r
E
n
ded
D
ecember 31
,
20
1
9
Net asset value, beginning of the period $ 29.01 $ 43.12 $ 39.04 $ 36.53 $ 31.0
0
INCOME (LOSS) FROM INVESTMENT OPERATIONS
:
Net investment income (loss)(a) 0.04 0.03 (0.11) (0.05) 0.15(b
)
Net realized and unrealized gain (loss) 10.66 (8.89) 8.99 7.66 9.3
4
Total from Investment Operations 10.70
(
8.86
)
8.88 7.61 9.4
9
L
ESS DISTRIBUTIONS FROM
:
Net investment income (0.03) (0.03) — — (0.17)
Net realized capital gains (2.95) (5.22) (4.80) (5.10) (3.79
)
Total Distributions
(
2.98
)(
5.25
)(
4.80
)(
5.10
)(
3.96
)
Net asset value, end of the period $ 36.73 $ 29.01 $ 43.12 $ 39.04 $ 36.53
T
otal return(c) 37.01
%
(21.15)
%
23.14
%
22.09
%
31.03
%
(b)
R
ATI
OS
T
O
AVERA
G
E NET A
SS
ET
S
:
Net assets, end of the period (000's)
$
612,653
$
512,392
$
733,423
$
649,754
$
616,922
Net expenses 1.10
%
1.12
%
1.14
%
1.17
%
1.17
%
G
ross expenses 1.10
%
1.12
%
1.14
%
1.17
%
1.17
%
Net investment income (loss) 0.11
%
0.09
%
(0.25)
%
(0.14)
%
0.42
%
(b
)
Portfolio turnover rate 36
%
46
%
18
%
26
%
12
%
(a) Per share net investment income (loss) has been calculated using the average shares outstanding during the period.
(b) Includes non-recurring dividends. Without this dividend, net investment income per share would have been $0.09, total return would have been 30.87% and the ratio
of net investment income to average net assets would have been 0.26%.
(c) A sales charge for Class A shares is not reflected in total return calculations.
Financial Highlights (continued)
F
or a share outstanding throughout eachperiod.
S
ee accompanying notes to financial statements.
67
|

N
atixis U.S. Equity Opportunities Fund—Class C
Yea
r
E
n
ded
D
ecember 31,
2023
Yea
r
E
n
ded
D
ecember 31
,
2022
Yea
r
E
n
ded
D
ecember 31,
2021
Yea
r
E
n
ded
D
ecember 31
,
2020
Yea
r
E
n
ded
D
ecember 31,
20
1
9
N
et asset value, beginning of the period $ 12.12 $ 21.82 $ 21.89 $ 22.65 $ 20.42
INCOME (LOSS) FROM INVESTMENT OPERATIONS:
N
et investment loss(a) (0.09) (0.12) (0.24) (0.19) (0.07)(b
)
N
et realized and unrealized gain (loss) 4.43 (4.36) 4.97 4.53 6.1
0
Total from Investment Operations 4.34
(
4.48
)
4.73 4.34 6.03
LE
SS DISTRIBUTIONS FROM:
N
et investment income ————(0.01
)
N
et realized capital gains (2.95) (5.22) (4.80) (5.10) (3.79)
Total Distributions
(
2.95
)(
5.22
)(
4.80
)(
5.10
)(
3.80
)
N
et asset value, end of the period $ 13.51 $ 12.12 $ 21.82 $ 21.89 $ 22.6
5
Total return(c) 35.98
%
(21.77)
%
22.27
%
21.15
%
30.06
%
(b)
RATI
OS
T
O
AVERA
G
E NET A
SS
ET
S:
N
et assets, end of the period (000's)
$
30,479
$
29,356
$
57,492
$
63,126
$
77,92
4
N
et expenses 1.85
%
1.87
%
1.89
%
1.92
%
1.92
%
Gross expenses 1.85
%
1.87
%
1.89
%
1.92
%
1.92
%
N
et investment loss (0.64)
%
(0.66)
%
(0.99)
%
(0.87)
%
(0.31)
%
(b
)
P
ortfolio turnover rate 36
%
46
%
18
%
26
%
12
%
(a) Per share net investment loss has been calculated using the average shares outstanding during the period.
(b) Includes non-recurring dividends. Without this dividend, net investment loss per share would have been $(0.11), total return would have been 29.85% and the ratio of
net investment loss to average net assets would have been (0.48)%.
(c) A contingent deferred sales charge for Class C shares is not reflected in total return calculations.
Financial Highlights (continued)
F
or a share outstanding throughout eachperiod.
S
ee accompanying notes to financial statements.
|
68

N
atixis U.S. Equity Opportunities Fund—Class N
Yea
r
E
n
ded
D
ecember 31,
2023
Yea
r
E
n
ded
D
ecember 31
,
2022
Yea
r
E
n
ded
D
ecember 31,
2021
Yea
r
E
n
ded
D
ecember 31
,
2020
Yea
r
E
n
ded
D
ecember 31,
20
1
9
Net asset value, beginning of the period $37.72 $ 54.14 $47.84 $43.61 $36.3
7
INCOME (LOSS) FROM INVESTMENT OPERATIONS:
Net investment income(a) 0.20 0.18 0.03 0.13 0.19(b)
Net realized and unrealized gain (loss) 13.89 (11.23) 11.07 9.20 11.1
4
Total from Investment Operations 14.09
(
11.05
)
11.10 9.33 11.3
3
LESS DISTRIBUTIONS FROM:
Net investment income (0.15) (0.15) — — (0.30)
Net realized capital gains (2.95) (5.22) (4.80) (5.10) (3.79
)
Total Distributions
(
3.10
)(
5.37
)(
4.80
)(
5.10
)(
4.09
)
Net asset value, end of the period $48.71 $ 37.72 $54.14 $47.84 $43.6
1
Total return(c) 37.44
%
(20.88)
%
23.53
%
22.48
%
31.44
%
(b
)
RATI
OS
T
O
AVERA
G
E NET A
SS
ET
S:
Net assets, end of the period (000's)
$
224
$
167
$
177
$
172
$
654
Net expenses(d) 0.78
%
0.81
%
0.83
%
0.84
%
0.83
%
Gross expenses 1.39
%
1.34
%
1.38
%
1.13
%
1.42
%
Net investment income 0.43
%
0.41
%
0.06
%
0.31
%
0.44
%
(b)
Portfolio turnover rate 36
%
46
%
18
%
26
%
12
%
(a) Per share net investment income has been calculated using the average shares outstanding during the period.
(b) Includes non-recurring dividends. Without this dividend, net investment income per share would have been $0.19, total return would have been 31.27% and the ratio
of net investment income to average net assets would have been 0.44%.
(c) Had certain expenses not been waived/reimbursed during the period, total returns would have been lower.
(d) The investment adviser agreed to waive its fees and/or reimburse a portion of the Fund’s expenses during the period. Without this waiver/reimbursement, expenses
would have been higher.
Financial Highlights (continued)
For a share outstanding throughout eachperiod.
S
ee accompanying notes to financial statements.
6
9
|

N
atixis U.S. Equity Opportunities Fund—Class
Y
Yea
r
E
n
ded
D
ecember 31,
2023
Yea
r
E
n
ded
D
ecember 31
,
2022
Yea
r
E
n
ded
D
ecember 31,
2021
Yea
r
E
n
ded
D
ecember 31
,
2020
Yea
r
E
n
ded
D
ecember 31,
20
1
9
N
et asset value, beginning of the period $ 37.60 $ 53.99 $ 47.74 $ 43.56 $ 36.3
3
INCOME (LOSS) FROM INVESTMENT OPERATIONS:
N
et investment income(a) 0.17 0.15 0.00(b) 0.05 0.29(c
)
N
et realized and unrealized gain (loss) 13.84 (11.20) 11.05 9.23 10.99
Total from Investment Operations 14.01
(
11.05
)
11.05 9.28 11.2
8
LESS DISTRIBUTIONS FROM:
N
et investment income (0.12) (0.12) — — (0.26)
N
et realized capital gains (2.95) (5.22) (4.80) (5.10) (3.79)
Total Distributions
(
3.07
)(
5.34
)(
4.80
)(
5.10
)(
4.05
)
N
et asset value, end of the period $ 48.54 $ 37.60 $ 53.99 $ 47.74 $ 43.56
Total return 37.35
%
(20.95)
%
23.48
%
22.36
%
31.36
%
(c)(d)
RATI
OS
T
O
AVERA
G
E NET A
SS
ET
S:
N
et assets, end of the period (000's)
$
322,106
$
191,912
$
284,738
$
243,302
$
283,864
N
et expenses 0.85
%
0.87
%
0.89
%
0.92
%
0.91
%
(e)
Gross expenses 0.85
%
0.87
%
0.89
%
0.92
%
0.92
%
N
et investment income 0.37
%
0.35
%
0.00(f) 0.13
%
0.69
%
(c)
P
ortfolio turnover rate 36
%
46
%
18
%
26
%
12
%
(a) Per share net investment income has been calculated using the average shares outstanding during the period.
(b) Amount rounds to less than $0.01 per share.
(c) Includes non-recurring dividends. Without this dividend, net investment income per share would have been $0.22, total return would have been 31.16% and the ratio
of net investment income to average net assets would have been 0.53%.
(d) Had certain expenses not been waived/reimbursed during the period, total returns would have been lower.
(e) The administrator agreed to waive its fees and/or reimburse a portion of the Fund’s expenses during the period. Without this waiver/reimbursement, expenses would
have been higher.
(f) Amount rounds to less than 0.01%.
Financial Highlights (continued)
F
or a share outstanding throughout eachperiod.
S
ee accompanying notes to financial statements.
|
70

V
aughan Nelson Mid Cap Fund—Class A
Yea
r
E
n
ded
D
ecember 31,
2023
Yea
r
E
n
ded
D
ecember 31
,
2022
Yea
r
E
n
ded
D
ecember 31,
2021
Yea
r
E
n
ded
D
ecember 31
,
2020
Yea
r
E
n
ded
D
ecember 31,
20
1
9
Net asset value, beginning of the period $ 19.64 $ 22.70 $ 21.79 $ 22.42 $ 17.3
7
INCOME (LOSS) FROM INVESTMENT OPERATIONS:
Net investment income(a) 0.05 0.11 0.05 0.07 0.03
Net realized and unrealized gain (loss) 3.14 (2.53) 4.52 1.96 5.2
1
Total from Investment Operations 3.19
(
2.42
)
4.57 2.03 5.24
LE
SS DISTRIBUTIONS FROM:
Net investment income (0.07) (0.13) (0.04) (0.04) (0.02)
Net realized capital gains — (0.51) (3.62) (2.62) (0.17
)
Total Distributions
(
0.07
)(
0.64
)(
3.66
)(
2.66
)(
0.19
)
Net asset value, end of the period $ 22.76 $ 19.64 $ 22.70 $ 21.79 $ 22.42
Total return(b)(c) 16.26
%
(10.80)
%
21.32
%
10.46
%
30.21
%
RATI
OS
T
O
AVERA
G
E NET A
SS
ET
S:
Net assets, end of the period (000's)
$
38,864
$
33,507
$
37,849
$
30,567
$
33,43
4
Net expenses(d) 1.15
%
1.15
%
1.17
%
(e) 1.20
%
1.25
%
(f)(g
)
Gross expenses 1.25
%
1.21
%
1.23
%
1.29
%
1.28
%
(g)
Net investment income 0.25
%
0.55
%
0.22
%
0.35
%
0.16
%
Portfolio turnover rate 94
%
53
%
71
%
52
%
52
%
(a) Per share net investment income has been calculated using the average shares outstanding during the period.
(b) A sales charge for Class A shares is not reflected in total return calculations.
(c) Had certain expenses not been waived/reimbursed during the period, total returns would have been lower.
(d) The investment adviser agreed to waive its fees and/or reimburse a portion of the Fund’s expenses during the period. Without this waiver/reimbursement, expenses
would have been higher.
(e) Effective July 1, 2021, the expense limit decreased from 1.20% to 1.15%.
(f) Effective July 1, 2019, the expense limit decreased from 1.40% to 1.20%.
(g) Includes interest expense. Without this expense the ratio of net expenses would have been 1.23% and the ratio of gross expenses would have been 1.26%.
Financial Highlights (continued)
F
or a share outstanding throughout eachperiod.
S
ee accompanying notes to financial statements.
71
|

Vaughan Nelson Mid Cap Fund—Class C
Yea
r
E
n
ded
D
ecember 31
,
2023
Yea
r
E
n
ded
D
ecember 31,
2022
Yea
r
E
n
ded
D
ecember 31
,
2021
Yea
r
E
n
ded
D
ecember 31,
2020
Yea
r
E
n
ded
D
ecember 31
,
20
1
9
Net asset value, beginning of the period $17.75 $ 20.58 $ 20.15 $ 21.06 $ 16.4
3
INCOME (LOSS) FROM INVESTMENT OPERATIONS
:
Net investment loss(a) (0.10) (0.04) (0.13) (0.08) (0.10)
Net realized and unrealized gain (loss) 2.83 (2.28) 4.18 1.79 4.90
Total from Investment Operations 2.73
(
2.32
)
4.05 1.71 4.80
L
ESS DISTRIBUTIONS FROM
:
Net investment income — — (0.00)(b) — (0.00)(b)
Net realized capital gains — (0.51) (3.62) (2.62) (0.17)
Total Distributions —
(
0.51
)(
3.62
)(
2.62
)(
0.17
)
Net asset value, end of the period $20.48 $ 17.75 $ 20.58 $ 20.15 $ 21.0
6
T
otal return(c)(d) 15.38
%
(11.46)
%
20.44
%
9.60
%
29.25
%
RATI
OS
T
O
AVERA
G
E NET A
SS
ET
S
:
Net assets, end of the period (000's)
$
3,650
$
7,405
$
11,436
$
14,023
$
21,932
Net expenses(e) 1.90
%
1.90
%
1.93
%
(f) 1.95
%
1.99
%
(g)(h)
Gross expenses 2.00
%
1.96
%
1.98
%
2.04
%
2.02
%
(h)
Net investment loss (0.55)
%
(0.22)
%
(0.56)
%
(0.42)
%
(0.50)
%
Portfolio turnover rate 94
%
53
%
71
%
52
%
52
%
(a) Per share net investment loss has been calculated using the average shares outstanding during the period.
(b) Amount rounds to less than $0.01 per share.
(c) A contingent deferred sales charge for Class C shares is not reflected in total return calculations.
(d) Had certain expenses not been waived/reimbursed during the period, total returns would have been lower.
(e) The investment adviser agreed to waive its fees and/or reimburse a portion of the Fund’s expenses during the period. Without this waiver/reimbursement, expenses
would have been higher.
(f) Effective July 1, 2021, the expense limit decreased from 1.95% to 1.90%.
(g) Effective July 1, 2019, the expense limit decreased from 2.15% to 1.95%.
(h) Includes interest expense. Without this expense the ratio of net expenses would have been 1.98% and the ratio of gross expenses would have been 2.01%.
Financial Highlights (continued)
F
or a share outstanding throughout eachperiod.
S
ee accompanying notes to financial statements.
|
72

V
aughan Nelson Mid Cap Fund—Class N
Yea
r
E
n
ded
D
ecember 31
,
2023
Yea
r
E
n
ded
December 31
,
2022
Yea
r
E
n
ded
D
ecember 31
,
2021
Yea
r
E
n
ded
D
ecember 31,
2020
Yea
r
E
n
ded
D
ecember 31
,
20
1
9
Net asset value, beginning of the period $ 19.95 $ 23.05 $ 22.07 $ 22.66 $ 17.54
INCOME (LOSS) FROM INVESTMENT OPERATIONS
:
Net investment income(a) 0.11 0.17 0.14 0.13 0.11
Net realized and unrealized gain (loss) 3.19 (2.57) 4.58 2.00 5.2
7
Total from Investment Operations 3.30
(
2.40
)
4.72 2.13 5.38
LE
SS DISTRIBUTIONS FROM
:
Net investment income (0.13) (0.19) (0.12) (0.10) (0.09)
Net realized capital gains — (0.51) (3.62) (2.62) (0.17
)
Total Distributions
(
0.13
)(
0.70
)(
3.74
)(
2.72
)(
0.26
)
Net asset value, end of the period $ 23.12 $ 19.95 $ 23.05 $ 22.07 $ 22.66
Total return(b) 16.56
%
(10.54)
%
21.70
%
10.83
%
30.67
%
RATI
OS
T
O
AVERA
G
E NET A
SS
ET
S
:
Net assets, end of the period (000's)
$
63,894
$
72,804
$
91,416
$
17,965
$
18,262
Net expenses(c) 0.85
%
0.85
%
0.86
%
(d) 0.90
%
0.92
%
(e)(f)
Gross expenses 0.90
%
0.87
%
0.89
%
0.94
%
0.93
%
(f
)
Net investment income 0.55
%
0.84
%
0.55
%
0.65
%
0.51
%
Portfolio turnover rate 94
%
53
%
71
%
52
%
52
%
(a) Per share net investment income has been calculated using the average shares outstanding during the period.
(b) Had certain expenses not been waived/reimbursed during the period, total returns would have been lower.
(c) The investment adviser agreed to waive its fees and/or reimburse a portion of the Fund’s expenses during the period. Without this waiver/reimbursement, expenses
would have been higher.
(d) Effective July 1, 2021, the expense limit decreased from 0.90% to 0.85%.
(e) Effective July 1, 2019, the expense limit decreased from 1.10% to 0.90%.
(f) Includes interest expense. Without this expense the ratio of net expenses would have been 0.91% and the ratio of gross expenses would have been 0.91%.
Financial Highlights (continued)
F
or a share outstanding throughout eachperiod.
S
ee accompanying notes to financial statements.
73
|

Vaughan Nelson Mid Cap Fund—Class
Y
Yea
r
E
n
ded
D
ecember 31
,
2023
Yea
r
E
n
ded
D
ecember 31,
2022
Yea
r
E
n
ded
D
ecember 31
,
2021
Yea
r
E
n
ded
D
ecember 31,
2020
Yea
r
E
n
ded
D
ecember 31
,
20
1
9
Net asset value, beginning of the period $ 19.99 $ 23.09 $ 22.10 $ 22.69 $ 17.5
7
INCOME (LOSS) FROM INVESTMENT OPERATIONS
:
Net investment income(a) 0.10 0.16 0.11 0.12 0.10
Net realized and unrealized gain (loss) 3.20 (2.57) 4.60 2.00 5.26
Total from Investment Operations 3.30
(
2.41
)
4.71 2.12 5.36
L
ESS DISTRIBUTIONS FROM
:
Net investment income (0.12) (0.18) (0.10) (0.09) (0.07)
Net realized capital gains — (0.51) (3.62) (2.62) (0.17
)
Total Distributions
(
0.12
)(
0.69
)(
3.72
)(
2.71
)(
0.24
)
Net asset value, end of the period $ 23.17 $ 19.99 $ 23.09 $ 22.10 $ 22.6
9
T
otal return(b) 16.52
%
(10.58)
%
21.65
%
10.76
%
30.52
%
R
ATI
OS
T
O
AVERA
G
E NET A
SS
ET
S
:
Net assets, end of the period (000's)
$
144,247
$
148,505
$
226,838
$
227,501
$
298,705
Net expenses(c) 0.90
%
0.90
%
0.93
%
(d) 0.95
%
1.00
%
(e)(f
)
G
ross expenses 1.00
%
0.96
%
0.98
%
1.04
%
1.02
%
(f
)
Net investment income 0.49
%
0.78
%
0.45
%
0.60
%
0.48
%
Portfolio turnover rate 94
%
53
%
71
%
52
%
52
%
(a) Per share net investment income has been calculated using the average shares outstanding during the period.
(b) Had certain expenses not been waived/reimbursed during the period, total returns would have been lower.
(c) The investment adviser agreed to waive its fees and/or reimburse a portion of the Fund’s expenses during the period. Without this waiver/reimbursement, expenses
would have been higher.
(d) Effective July 1, 2021, the expense limit decreased from 0.95% to 0.90%.
(e) Effective July 1, 2019, the expense limit decreased from 1.15% to 0.95%.
(f) Includes interest expense. Without this expense the ratio of net expenses would have been 0.98% and the ratio of gross expenses would have been 1.01%.
Financial Highlights (continued)
F
or a share outstanding throughout eachperiod.
S
ee accompanying notes to financial statements.
|
74

Vaughan Nelson Small Cap Value Fund—Class
A
Yea
r
E
n
ded
D
ecember 31
,
2023
Yea
r
E
n
ded
December 31
,
2022
Yea
r
E
n
ded
D
ecember 31
,
2021
Yea
r
E
n
ded
December 31
,
2020
Yea
r
E
n
ded
D
ecember 31
,
20
1
9
Net asset value, beginning of the period $ 15.17 $ 17.87 $ 16.69 $ 15.45 $ 12.48
INCOME (LOSS) FROM INVESTMENT OPERATIONS
:
Net investment income (loss)(a) 0.09 (0.02) 0.00(b)(c) 0.00(b) 0.0
2
Net realized and unrealized gain (loss) 3.67 (1.78) 4.98 1.33 3.06
Total from Investment Operations 3.76
(
1.80
)
4.98 1.33 3.08
L
ESS DISTRIBUTIONS FROM
:
Net investment income (0.05) — (0.01) (0.00)(b) (0.03
)
Net realized capital gains — (0.90) (3.79) (0.09) (0.08
)
Total Distributions
(
0.05
)(
0.90
)(
3.80
)(
0.09
)(
0.11
)
Net asset value, end of the period $ 18.88 $ 15.17 $ 17.87 $ 16.69 $ 15.45
Total return(d)(e) 24.82
%
(10.19)
%
30.24
%
(c) 8.91
%
24.66
%
RATI
OS
T
O
AVERA
G
E NET A
SS
ET
S
:
Net assets, end of the period (000's)
$
111,268
$
66,339
$
81,493
$
61,571
$
67,52
5
Net expenses(f) 1.25
%
1.25
%
1.27
%
(g) 1.32
%
(h) 1.40
%
(i)
Gross expenses 1.37
%
1.37
%
1.43
%
1.53
%
1.47
%
Net investment income (loss) 0.53
%
(0.12)
%
0.01
%
(c) 0.02
%
0.12
%
Portfolio turnover rate 72
%
63
%
92
%
105
%
61
%
(a) Per share net investment income (loss) has been calculated using the average shares outstanding during the period.
(b) Amount rounds to less than $0.01 per share.
(c) Includes a non-recurring dividend. Without this dividend, net investment loss per share would have been $(0.05), total return would have been 29.95% and the ratio of
net investment loss to average net assets would have been (0.25)%.
(d) A sales charge for Class A shares is not reflected in total return calculations.
(e) Had certain expenses not been waived/reimbursed during the period, total returns would have been lower.
(f) The investment adviser agreed to waive its fees and/or reimburse a portion of the Fund’s expenses during the period. Without this waiver/reimbursement, expenses
would have been higher.
(g) Effective July 1, 2021, the expense limit decreased from 1.30% to 1.25%.
(h) Effective July 1, 2020, the expense limit decreased from 1.34% to 1.30%.
(i) Effective July 1, 2019, the expense limit decreased from 1.45% to 1.34%.
Financial Highlights (continued)
F
or a share outstanding throughout eachperiod.
S
ee accompanying notes to financial statements.
75
|

Vaughan Nelson Small Cap Value Fund—Class C
Yea
r
E
n
ded
D
ecember 31
,
2023
Yea
r
E
n
ded
D
ecember 31
,
2022
Yea
r
E
n
ded
D
ecember 31
,
2021
Yea
r
E
n
ded
December 31
,
2020
Yea
r
E
n
ded
D
ecember 31
,
20
1
9
N
et asset value, beginning of the period $ 5.30 $ 6.94 $ 8.34 $ 7.84 $ 6.41
INCOME (LOSS) FROM INVESTMENT OPERATIONS
:
N
et investment loss(a) (0.01) (0.04) (0.06)(b) (0.05) (0.05)
N
et realized and unrealized gain (loss) 1.28 (0.70) 2.45 0.64 1.5
7
Total from Investment Operations 1.27
(
0.74
)
2.39 0.59 1.5
2
L
ESS DISTRIBUTIONS FROM
:
N
et investment income (0.06) — — (0.00)(c) (0.01)
N
et realized capital gains — (0.90) (3.79) (0.09) (0.08)
Total Distributions
(
0.06
)(
0.90
)(
3.79
)(
0.09
)(
0.09
)
N
et asset value, end of the period $ 6.51 $ 5.30 $ 6.94 $ 8.34 $ 7.84
Total return(d)(e) 23.93
%
(11.01)
%
29.45
%
(b) 8.08
%
23.69
%
RATI
OS
T
O
AVERA
G
E NET A
SS
ET
S
:
N
et assets, end of the period (000's)
$
7,988
$
2,118
$
966
$
983
$
1,450
N
et expenses(f) 2.00
%
2.00
%
2.03
%
(g) 2.07
%
(h) 2.16
%
(i)
G
ross expenses 2.12
%
2.12
%
2.19
%
2.28
%
2.23
%
N
et investment loss (0.14)
%
(0.74)
%
(0.67)
%
(b) (0.71)
%
(0.68)
%
Portfolio turnover rate 72
%
63
%
92
%
105
%
61
%
(a) Per share net investment loss has been calculated using the average shares outstanding during the period.
(b) Includes a non-recurring dividend. Without this dividend, net investment loss per share would have been $(0.10), total return would have been 29.09% and the ratio of
net investment loss to average net assets would have been (0.99)%.
(c) Amount rounds to less than $0.01 per share.
(d) A contingent deferred sales charge for Class C shares is not reflected in total return calculations.
(e) Had certain expenses not been waived/reimbursed during the period, total returns would have been lower.
(f) The investment adviser agreed to waive its fees and/or reimburse a portion of the Fund’s expenses during the period. Without this waiver/reimbursement, expenses
would have been higher.
(g) Effective July 1, 2021, the expense limit decreased from 2.05% to 2.00%.
(h)
Effective July 1, 2020, the expense limit decreased from 2.09% to 2.05%.
(i) Effective July 1, 2019, the expense limit decreased from 2.20% to 2.09%.
Financial Highlights (continued)
F
or a share outstanding throughout eachperiod.
S
ee accompanying notes to financial statements.
|
76

V
aughan Nelson Small Cap Value Fund—Class N
Yea
r
E
n
ded
D
ecember 31
,
2023
Yea
r
E
n
ded
D
ecember 31
,
2022
Yea
r
E
n
ded
December 31
,
202
1
Yea
r
E
n
ded
D
ecember 31
,
2020
Yea
r
E
n
ded
December 31
,
20
1
9
Net asset value, beginning of the period $16.16 $18.96 $17.52 $16.20 $13.08
INCOME (LOSS) FROM INVESTMENT OPERATIONS:
Net investment income(a) 0.15 0.04 0.01(b) 0.04 0.08
Net realized and unrealized
gain (loss) 3.93 (1.91) 5.29 1.42 3.2
0
Total from Investment Operations 4.08
(
1.87
)
5.30 1.46 3.28
L
ESS DISTRIBUTIONS FROM
:
Net investment income (0.10) (0.03) (0.07) (0.05) (0.08
)
Net realized capital gains — (0.90) (3.79) (0.09) (0.08
)
Total Distributions
(
0.10
)(
0.93
)(
3.86
)(
0.14
)(
0.16
)
Net asset value, end of the period $20.14 $16.16 $18.96 $17.52 $16.20
Total return(c) 25.24
%
(9.95)
%
30.64
%
(b) 9.27
%
25.08
%
RATI
OS
T
O
AVERA
G
E NET A
SS
ET
S:
Net assets, end of the period (000's)
$
2,506
$
1,493
$
1,383
$
23
$
21
Net expenses(d) 0.95
%
0.95
%
0.97
%
(e) 1.02
%
(f) 1.03
%
(g)
Gross expenses 1.08
%
1.10
%
1.19
%
6.54
%
11.80
%
Net investment income 0.84
%
0.22
%
0.03
%
(b) 0.31
%
0.52
%
Portfolio turnover rate 72
%
63
%
92
%
105
%
61
%
(a) Per share net investment income has been calculated using the average shares outstanding during the period.
(b) Includes a non-recurring dividend. Without this dividend, net investment income per share would have been $0.01, total return would have been 30.37% and the ratio
of net investment income to average net assets would have been 0.03%.
(c) Had certain expenses not been waived/reimbursed during the period, total returns would have been lower.
(d) The investment adviser agreed to waive its fees and/or reimburse a portion of the Fund’s expenses during the period. Without this waiver/reimbursement, expenses
would have been higher.
(e) Effective July 1, 2021, the expense limit decreased from 1.00% to 0.95%.
(f) Effective July 1, 2020, the expense limit decreased from 1.04% to 1.00%.
(g) Effective July 1, 2019, the expense limit decreased from 1.15% to 1.04%.
Financial Highlights (continued)
For a share outstanding throughout eachperiod.
S
ee accompanying notes to financial statements.
77
|

Vaughan Nelson Small Cap Value Fund—Class
Y
Yea
r
E
n
ded
D
ecember 31
,
2023
Yea
r
E
n
ded
December 31
,
2022
Yea
r
E
n
ded
D
ecember 31
,
2021
Yea
r
E
n
ded
December 31
,
2020
Yea
r
E
n
ded
D
ecember 31
,
20
1
9
Net asset value, beginning of the period $ 16.15 $ 18.95 $ 17.51 $ 16.19 $ 13.08
INCOME (LOSS) FROM INVESTMENT OPERATIONS
:
Net investment income(a) 0.16 0.04 0.06(b) 0.04 0.05
Net realized and unrealized gain (loss) 3.89 (1.91) 5.23 1.41 3.2
1
Total from Investment Operations 4.05
(
1.87
)
5.29 1.45 3.26
L
ESS DISTRIBUTIONS FROM
:
Net investment income (0.09) (0.03) (0.06) (0.04) (0.07)
Net realized capital gains — (0.90) (3.79) (0.09) (0.08
)
Total Distributions
(
0.09
)(
0.93
)(
3.85
)(
0.13
)(
0.15
)
Net asset value, end of the period $ 20.11 $ 16.15 $ 18.95 $ 17.51 $ 16.19
Total return(c) 25.10
%
(9.98)
%
30.61
%
(b) 9.23
%
24.88
%
RATI
OS
T
O
AVERA
G
E NET A
SS
ET
S
:
Net assets, end of the period (000's)
$
530,371
$
120,585
$
66,054
$
49,315
$
44,482
Net expenses(d) 1.00
%
1.00
%
1.02
%
(e) 1.07
%
(f) 1.15
%
(g
)
Gross expenses 1.12
%
1.12
%
1.18
%
1.28
%
1.23
%
Net investment income 0.91
%
0.22
%
0.28
%
(b) 0.26
%
0.35
%
Portfolio turnover rate 72
%
63
%
92
%
105
%
61
%
(a) Per share net investment income has been calculated using the average shares outstanding during the period.
(b) Includes a non-recurring dividend. Without this dividend, net investment income per share would have been $0.00, total return would have been 30.26% and the ratio
of net investment income to average net assets would have been 0.01%.
(c) Had certain expenses not been waived/reimbursed during the period, total returns would have been lower.
(d) The investment adviser agreed to waive its fees and/or reimburse a portion of the Fund’s expenses during the period. Without this waiver/reimbursement, expenses
would have been higher.
(e) Effective July 1, 2021, the expense limit decreased from 1.05% to 1.00%.
(f) Effective July 1, 2020, the expense limit decreased from 1.09% to 1.05%.
(g) Effective July 1, 2019, the expense limit decreased from 1.20% to 1.09%.
Financial Highlights (continued)
F
or a share outstanding throughout eachperiod.
S
ee accompanying notes to financial statements.
|
78

1. Organization. Loomis Sayles Funds II, Natixis Funds Trust I and Natixis Funds Trust II (the “Trusts” and each a “Trust”) are each
organized as a Massachusetts business trust. Each Trust is registered under the Investment Company Act of 1940, as amended (the
“1940 Act”), as an open-end management investment company. Each Declaration of Trust permits the Board of Trustees to authorize
the issuance of an unlimited number of shares of the Trust in multiple series. The financial statements for certain funds of the Trusts are
presented in separate reports. The following funds (individually, a “Fund” and collectively, the “Funds”) are included in this report:
Loomis Sayles Funds II:
Loomis Sayles International Growth Fund (“International Growth Fund”)
Natixis Funds Trust I:
Natixis Oakmark International Fund
Natixis U.S. Equity Opportunities Fund (“U.S. Equity Opportunities Fund”)
Vaughan Nelson Small Cap Value Fund (“Small Cap Value Fund”)
Natixis Funds Trust II:
Natixis Oakmark Fund
Vaughan Nelson Mid Cap Fund (“Mid Cap Fund”)
Each Fund is a diversified investment company, except for International Growth Fund, which is a non-diversified investment company.
Each Fund offers Class A, Class C, Class N and Class Y shares.
Class A shares are sold with a maximum front-end sales charge of 5.75%. Class C shares do not pay a front-end sales charge, pay
higher Rule 12b-1 fees than Class A shares for eight years (at which point they automatically convert to Class A shares) (prior to May 1,
2021, Class C shares automatically converted to Class A shares after ten years) and may be subject to a contingent deferred sales
charge (“CDSC”) of 1.00% if those shares are redeemed within one year of acquisition, except for reinvested distributions. Class N and
Class Y shares do not pay a front-end sales charge, a CDSC or Rule 12b-1 fees. Class N shares are offered with an initial minimum
investment of $1,000,000. Class Y shares are offered with an initial minimum investment of $100,000. Certain categories of investors are
exempted from the minimum investment amounts for Class N and Class Y as outlined in the relevant Funds’ prospectus.
Most expenses can be directly attributed to a Fund. Expenses which cannot be directly attributed to a Fund are generally apportioned
based on the relative net assets of each of the Funds in Natixis Funds Trust I, Natixis Funds Trust II, Natixis Funds Trust IV and Gateway
Trust (“Natixis Funds Trusts”), Loomis Sayles Funds I and Loomis Sayles Funds II (“Loomis Sayles Funds Trusts”) and Natixis ETF Trust
and Natixis ETF Trust II (“Natixis ETF Trusts”). Expenses of a Fund are borne pro rata by the holders of each class of shares, except that
each class bears expenses unique to that class (such as the Rule 12b-1 fees applicable to Class A and Class C), and transfer agent fees
are borne collectively for Class A, Class C and Class Y, and individually for Class N. In addition, each class votes as a class only with
respect to its own Rule 12b-1 Plan. Shares of each class would receive their pro rata share of the net assets of the Fund if the Fund
were liquidated. The Trustees approve separate distributions from net investment income on each class of shares.
2. Significant Accounting Policies. The following is a summary of significant accounting policies consistently followed by each Fund
in the preparation of its financial statements. The Funds' financial statements follow the accounting and reporting guidelines provided
for investment companies and are prepared in accordance with accounting principles generally accepted in the United States of
America which require the use of management estimates that affect the reported amounts and disclosures in the financial statements.
Actual results could differ from those estimates. Management has evaluated the events and transactions subsequent to year-end
through the date the financial statements were issued and has determined that there were no material events that would require
disclosure in the Funds' financial statements.
a. Valuation. Registered investment companies are required to value portfolio investments using an unadjusted, readily available
market quotation. Each Fund obtains readily available market quotations from independent pricing services. Fund investments for
which readily available market quotations are not available are priced at fair value pursuant to the Funds’ Valuation Procedures. The
Board of Trustees has approved a valuation designee who is subject to the Board’s oversight.
Unadjusted readily available market quotations that are utilized for exchange traded equity securities (including shares of closed-end
investment companies and exchange-traded funds) include the last sale price quoted on the exchange where the security is traded
most extensively. Shares of open-end investment companies are valued at net asset value (“NAV”) per share.
Exchange traded equity securities for which there is no reported sale during the day are fair valued at the closing bid quotation as
reported by an independent pricing service. Unlisted equity securities (except unlisted preferred equity securities) are fair valued at the
last sale price quoted in the market where they are traded most extensively or, if there is no reported sale during the day, the closing
Notes to Financial Statements
December 31, 2023
7
9
|
bid quotation as reported by an independent pricing service. If there is no last sale price or closing bid quotation available, unlisted
equity securities will be fair valued using evaluated bids furnished by an independent pricing service, if available.
Debt securities and unlisted preferred equity securities are fair valued based on evaluated bids furnished to the Funds by an
independent pricing service or bid prices obtained from broker-dealers. Broker-dealer bid prices may be used to fair value debt and
unlisted equities where an independent pricing service is unable to price an investment or where an independent pricing service does
not provide a reliable price for the investment. Forward foreign currency contracts are fair valued utilizing interpolated rates
determined based on information provided by an independent pricing service.
The Funds may also fair value investments in other circumstances such as when extraordinary events occur after the close of a foreign
market, but prior to the close of the New York Stock Exchange. This may include situations relating to a single issuer (such as a
declaration of bankruptcy or a delisting of the issuer’s security from the primary market on which it has traded) as well as events
affecting the securities markets in general (such as market disruptions or closings and significant fluctuations in U.S. and/or foreign
markets). When fair valuing a Fund’s investments, the valuation designee may, among other things, use modeling tools or other
processes that may take into account factors such as issuer specific information, or other related market activity and/or information
that occurred after the close of the foreign market but before the time the Fund’s NAV is calculated. Fair valuation by the Fund(s)
valuation designee may require subjective determinations about the value of the investment, and fair values used to determine a Fund’s
NAV may differ from quoted or published prices, or from prices that are used by others, for the same investments. In addition, the use of
fair value pricing may not always result in adjustments to the prices of investments held by a Fund.
b. Investment Transactions and Related Investment Income. Investment transactions are accounted for on a trade date plus one day
basis for daily NAV calculation. However, for financial reporting purposes, investment transactions are reported on trade date.
Dividend income (including income reinvested) and foreign withholding tax, if applicable, is recorded on the ex-dividend date, or in the
case of certain foreign securities, as soon as a Fund is notified, and interest income is recorded on an accrual basis. Dividends
reinvested and stock dividends are reflected as non-cash dividends on the Statements of Operations. Interest income is increased by
the accretion of discount and decreased by the amortization of premium, if applicable. Distributions received from investments in
securities that represent a return of capital or capital gain are recorded as a reduction of cost of investments or as a realized gain,
respectively. The calendar year-end amounts of ordinary income, capital gains and return of capital included in distributions received
from the Funds’ investments in real estate investment trusts (“REITs”) are reported to the Funds after the end of the fiscal year;
accordingly, the Funds estimate these amounts for accounting purposes until the characterization of REIT distributions is reported to
the Funds after the end of the fiscal year. Estimates are based on the most recent REIT distribution information available. In determining
net gain or loss on securities sold, the cost of securities has been determined on an identified cost basis. Investment income, non-class
specific expenses and realized and unrealized gains and losses are allocated on a pro rata basis to each class based on the relative
net assets of each class to the total net assets of the Fund.
c. Foreign Currency Translation. The books and records of the Funds are maintained in U.S. dollars. The values of securities,
currencies and other assets and liabilities denominated in currencies other than U.S. dollars, if any, are translated into U.S. dollars
based upon foreign exchange rates prevailing at the end of the period. Purchases and sales of investment securities, income and
expenses are translated into U.S. dollars on the respective dates of such transactions.
Net realized foreign exchange gains or losses arise from sales of foreign currency, changes in exchange rates between the trade and
settlement dates on securities transactions and the difference between the amounts of dividends, interest and foreign withholding
taxes recorded in the Funds’ books and records and the U.S. dollar equivalent of the amounts actually received or paid. Net unrealized
foreign exchange gains or losses arise from changes in the value of assets and liabilities, other than investment securities, as of the
end of the fiscal period, resulting from changes in exchange rates. Net realized foreign exchange gains or losses and the net change in
unrealized foreign exchange gains or losses are disclosed in the Statements of Operations. For federal income tax purposes, net
realized foreign exchange gains or losses are characterized as ordinary income, and may, if the Funds have net losses, reduce the
amount of income available to be distributed by the Funds.
The values of investment securities are presented at the foreign exchange rates prevailing at the end of the period for financial
reporting purposes. Net realized and unrealized gains or losses on investments reported in the Statements of Operations reflect gains
or losses resulting from changes in exchange rates and fluctuations which arise due to changes in market prices of investment
securities. For federal income tax purposes, a portion of the net realized gain or loss on investments arising from changes in exchange
rates, which is reflected in the Statements of Operations, may be characterized as ordinary income and may, if the Funds have net
losses, reduce the amount of income available to be distributed by the Funds.
The Funds may use foreign currency exchange contracts to facilitate transactions in foreign-denominated investments. Losses may
arise from changes in the value of the foreign currency or if the counterparties do not perform under the contracts’ terms.
Notes to Financial Statements
(
continued
)
D
ecember 31, 2023
|
8
0
d. Forward Foreign Currency Contracts. A Fund may enter into forward foreign currency contracts, including forward foreign cross
currency contracts, to acquire exposure to foreign currencies or to hedge the Funds’ investments against currency fluctuation. A
contract can also be used to offset a previous contract. These contracts involve market risk in excess of the unrealized appreciation
(depreciation) reflected in the Funds’ Statements of Assets and Liabilities. The U.S. dollar value of the currencies a Fund has committed
to buy or sell represents the aggregate exposure to each currency a Fund has acquired or hedged through currency contracts
outstanding at period end. Gains or losses are recorded for financial statement purposes as unrealized until settlement date. Contracts
are traded over-the-counter directly with a counterparty. Risks may arise upon entering into these contracts from the potential inability
of counterparties to meet the terms of their contracts and from unanticipated movements in the value of a foreign currency relative to
the U.S. dollar. Certain contracts may require the movement of cash and/or securities as collateral for the Funds’ or counterparty’s net
obligations under the contracts. Forward foreign currency contracts outstanding at the end of the period, if any, are listed in each
applicable Fund's Portfolio of Investments.
e. Federal and Foreign Income Taxes. The Trusts treat each Fund as a separate entity for federal income tax purposes. Each Fund
intends to meet the requirements of the Internal Revenue Code of 1986, as amended, applicable to regulated investment companies,
and to distribute to its shareholders substantially all of its net investment income and any net realized capital gains at least annually.
Management has performed an analysis of each Fund’s tax positions for the open tax years as of December 31, 2023 and has
concluded that no provisions for income tax are required. The Funds’ federal tax returns for the prior three fiscal years remain subject
to examination by the Internal Revenue Service. Management is not aware of any events that are reasonably possible to occur in the
next twelve months that would result in the amounts of any unrecognized tax benefits significantly increasing or decreasing for the
Funds. However, management’s conclusions regarding tax positions taken may be subject to review and adjustment at a later date
based on factors including, but not limited to, new tax laws and accounting regulations and interpretations thereof.
A Fund may be subject to foreign withholding taxes on investment income and taxes on capital gains on investments that are accrued
and paid based upon the Fund’s understanding of the tax rules and regulations that exist in the countries in which the Fund invests.
Foreign withholding taxes on dividend and interest income are reflected on the Statements of Operations as a reduction of investment
income, net of amounts that have been or are expected to be reclaimed and paid. Dividends and interest receivable on the Statements
of Assets and Liabilities are net of foreign withholding taxes. Foreign withholding taxes where reclaims have been or are expected to
be filed and paid are reflected on the Statements of Assets and Liabilities as tax reclaims receivable. Capital gains taxes paid are
included in net realized gain (loss) on investments in the Statements of Operations. Accrued but unpaid capital gains taxes are
reflected as foreign taxes payable on the Statements of Assets and Liabilities, if applicable, and reduce unrealized gains on
investments. In the event that realized gains on investments are subsequently offset by realized losses, taxes paid on realized gains
may be returned to a Fund. Such amounts, if applicable, are reflected as foreign tax rebates receivable on the Statements of Assets
and Liabilities and are recorded as a realized gain when received.
Certain Funds have filed tax reclaims for previously withheld taxes on dividends earned in certain European Union countries (“EU
reclaims”) and may continue to make such filings when it is determined to be in the best interest of the Funds and their shareholders.
These filings are subject to various administrative proceedings by the local jurisdictions’ tax authorities within the European Union, as
well as a number of related judicial proceedings. EU reclaims are recognized by a Fund when deemed more likely than not to be
collected, and are reflected as a reduction of foreign taxes withheld in the Statements of Operations. Any related receivable is
reflected as tax reclaims receivable in the Statements of Assets and Liabilities. Under certain circumstances, EU reclaims may be
subject to closing agreements with the Internal Revenue Service ("IRS"), which may materially reduce the reclaim amounts realized by
the Funds. Fees and expenses associated with closing agreements will be reflected in the Statements of Operations when it is
determined that a closing agreement with the IRS is required.
f. Dividends and Distributions to Shareholders. Dividends and distributions are recorded on the ex-dividend date. The timing and
characterization of certain income and capital gain distributions are determined in accordance with federal tax regulations, which may
differ from accounting principles generally accepted in the United States of America. Permanent differences are primarily due to
differing treatments for book and tax purposes of items such as capital gains taxes, deferred Trustees’ fees, forward foreign currency
contract mark-to-market, tax equalization, distribution re-designations, foreign currency gains and losses, corporate actions, passive
foreign investment company adjustments, return of capital distributions received and capital gain distribution received. Permanent
book and tax basis differences relating to shareholder distributions, net investment income and net realized gains will result in
reclassifications to capital accounts reported on the Statements of Assets and Liabilities. Temporary differences between book and tax
distributable earnings are primarily due to capital gains taxes, wash sales, forward foreign currency contract mark-to-market, return of
capital distributions received, corporate actions, deferred Trustees’ fees, deferral of EU reclaims, capital gain distribution received and
passive foreign investment company adjustments. Amounts of income and capital gain available to be distributed on a tax basis are
Notes to Financial Statements
(
continued
)
D
ecember 31, 2023
81
|

determined annually, and at other times during the Funds’ fiscal year as may be necessary to avoid knowingly declaring and paying a
return of capital distribution. Distributions from net investment income and short-term capital gains are considered to be distributed
from ordinary income for tax purposes.
The tax characterization of distributions is determined on an annual basis. The tax character of distributions paid to shareholders
during the years ended December 31, 2023 and 2022 was as follows:
2023
Di
str
ib
ut
i
ons 2022
Di
str
ib
ut
i
on
s
Fu
n
d
Ordinar
y
I
ncome
L
ong-
T
er
m
Capita
l
G
ains Total
Ordinar
y
I
ncome
L
ong-
T
erm
C
apital
Gains Total
International Growth Fund
$
185,268
$
—
$
185,268
$
177,885
$
—
$
177,885
Natixis
O
akmark Fund 3,814,121 18,473,243 22,287,364 2,835,653 51,140,399 53,976,05
2
Natixis Oakmark International Fund 6,846,278 — 6,846,278 6,459,857 — 6,459,857
U.
S
. Equity
O
pportunities Fund 26,791,709 44,583,934 71,375,643 1,935,796 120,599,489 122,535,28
5
Mid Cap Fund 1,259,368 — 1,259,368 2,282,950 7,705,713 9,988,66
3
Small Cap Value Fund 2,773,579 — 2,773,579 2,901,818 6,755,646 9,657,464
Distributions paid to shareholders from net investment income and net realized capital gains, based on accounting principles generally
accepted in the United States of America, are consolidated and reported on the Statements of Changes in Net Assets as Distributions
to Shareholders. Distributions paid to shareholders from net investment income and net realized capital gains expressed in per-share
amounts, based on accounting principles generally accepted in the United States of America, are separately stated and reported
within the Financial Highlights.
As of December 31, 2023, the components of distributable earnings on a tax basis were as follows:
International
G
rowth Fund
Natix
is
Oakmark
Fun
d
N
at
i
x
is
Oakmark
Internationa
l
Fun
d
U.S.
Equit
y
O
pportunitie
s
Fun
d
Undistributed ordinary income $ 7,408 $ 76,898 $ 404,419 $ 172,594
Undistributed long-term capital gains — 4,561,834 — —
Total undistributed earnings 7,408 4,638,732 404,419 172,594
C
apital loss carryforward
:
Short-term
:
No expiration date (113,821) — (9,746,895) —
L
ong-term
:
No expiration date — — (125,804,223)
—
Total capital loss carryforward (113,821) — (135,551,118)
—
Late-year ordinary and post-Octobe
r
capital loss deferrals
* — — —
(
17,046,776
)
Unrealized appreciation
(
depreciation
)(
836,118
)
76,895,264 21,979,199 306,425,05
4
Total accumulated earnings (losses)
$
(942,531)
$
81,533,996
$
(113,167,500)
$
289,550,872
Notes to Financial Statements
(
continued
)
D
ecember 31, 2023
|
8
2

Mid
Cap Fun
d
Small Ca
p
V
a
l
ue
F
un
d
Undistributed ordinary income $ 11,282 $ 62,50
1
Capital loss carryforward
:
S
hort-term
:
No expiration date
(
4,503,728
)(
5,119,417
)
Long-term
:
No expiration date — (3,896,979)
Total capital loss carryforward (4,503,728)(9,016,396)
U
nrea
li
ze
d
apprec
i
at
i
on 52,322,858 98,895,86
4
Total accumulated earnings
$
47,830,412
$
89,941,969
* Under current tax law, net operating losses, capital losses, foreign currency losses, and losses on passive foreign investment companies and contingent payment debt
instruments after October 31 or December 31, as applicable, may be deferred and treated as occurring on the first day of the following taxable year. U.S. Equity
Opportunities Fund is deferring capital losses.
As of December 31, 2023, the tax cost of investments (including derivatives, if applicable) and unrealized appreciation (depreciation) on
a federal tax basis were as follows:
I
nternat
io
n
al
G
rowth Fun
d
N
at
i
x
is
Oakmar
k
F
un
d
N
at
i
x
is
Oakmark
I
nternat
io
n
al
F
un
d
U.
S.
E
qu
i
t
y
Opportunitie
s
F
un
d
Mid
C
ap Fun
d
Small Ca
p
V
a
l
ue
F
un
d
Federal tax cost $31,300,954 $ 558,886,069 $ 361,130,920 $ 657,777,360 $ 196,949,236 $ 550,288,853
Gross tax appreciation
$
4,096,930
$
83,242,546
$
56,353,974
$
331,568,527
$
52,638,403
$
102,896,222
Gross tax depreciation
(
4,939,611
)(
6,347,282
)(
34,086,888
)(
25,143,398
)(
315,545
)(
4,000,358
)
Net tax appreciation (depreciation)
$
(842,681)
$
76,895,264
$
22,267,086
$
306,425,129
$
52,322,858
$
98,895,864
The difference between these amounts and those reported in the components of distributable earnings, if any, are primarily attributable
to foreign currency mark-to-market and foreign capital gains taxes.
g. Repurchase Agreements. Each Fund may enter into repurchase agreements, under the terms of a Master Repurchase Agreement,
under which each Fund acquires securities as collateral and agrees to resell the securities at an agreed upon time and at an agreed
upon price. It is each Fund’s policy that the market value of the collateral for repurchase agreements be at least equal to 102% of the
repurchase price, including interest. Certain repurchase agreements are tri-party arrangements whereby the collateral is held in a
segregated account for the benefit of the Fund and on behalf of the counterparty. Repurchase agreements could involve certain risks in
the event of default or insolvency of the counterparty, including possible delays or restrictions upon a Fund’s ability to dispose of the
underlying securities. As of December 31, 2023, each Fund, as applicable, had investments in repurchase agreements for which the
value of the related collateral exceeded the value of the repurchase agreement. The gross value of repurchase agreements is included
in the Statements of Assets and Liabilities for financial reporting purposes.
h. Indemnifications. Under the Trusts’ organizational documents, their officers and Trustees are indemnified against certain liabilities
arising out of the performance of their duties to the Funds. Additionally, in the normal course of business, the Funds enter into contracts
with service providers that contain general indemnification clauses. The Funds' maximum exposure under these arrangements is
unknown as this would involve future claims that may be made against the Funds that have not yet occurred. However, based on
experience, the Funds expect the risk of loss to be remote.
i. Regulatory Update. Effective January 24, 2023, the SEC adopted a release (the “Release”) containing rule and form amendments to
require mutual funds and ETFs to transmit concise and visually engaging streamlined annual and semiannual reports to shareholders
that highlight key information deemed important for retail investors to assess and monitor their fund investments. Other information,
including financial statements, will no longer appear in the new tailored shareholder reports but will be available online, delivered free
of charge upon request, and filed with the SEC on a semiannual basis on Form N-CSR. In addition to the removal of financial statements
from the new tailored shareholder reports, the Release requires mandatory mailing of the reports, unless a shareholder specifically
opts out and chooses electronic delivery. The Release also requires that the new tailored shareholder reports be no longer than 2-4
pages, include only a single share class of a single fund, and use a broad-based securities market index for performance comparison
Notes to Financial Statements
(
continued
)
D
ecember 31, 202
3
83
|

purposes. Management is evaluating the impact of the Release on the content of the current shareholder report and newly created
tailored shareholder reports and expects to meet the required compliance date of July 24, 2024.
3. Fair Value Measurements. In accordance with accounting standards related to fair value measurements and disclosures, the
Funds have categorized the inputs utilized in determining the value of each Fund’s assets or liabilities. These inputs are summarized in
the three broad levels listed below:
• Level 1 — quoted prices in active markets for identical assets or liabilities;
• Level 2 — prices determined using other significant inputs that are observable either directly, or indirectly through corroboration
with observable market data (which could include quoted prices for similar assets or liabilities, interest rates, credit risk, etc.);
and
• Level 3 — prices determined using significant unobservable inputs when quoted prices or observable inputs are unavailable such
as when there is little or no market activity for an asset or liability (unobservable inputs reflect each Fund’s own assumptions in
determining the fair value of assets or liabilities and would be based on the best information available).
The inputs or methodology used for valuing securities are not necessarily an indication of the risk associated with investing in those
securities.
The Funds' pricing policies have been approved by the Board of Trustees. Investments for which market quotations are readily
available are categorized in Level 1. Other investments for which an independent pricing service is utilized are categorized in Level 2.
Broker-dealer bid prices for which the Funds have knowledge of the inputs used by the broker-dealer are categorized in Level 2. All
other investments, including broker-dealer bid prices for which the Funds do not have knowledge of the inputs used by the broker-
dealer, as well as investments fair valued by the valuation designee, are categorized in Level 3. All Level 2 and 3 securities are defined
as being fair valued.
Under certain conditions and based upon specific facts and circumstances, the Fund’s valuation designee may determine that a fair
valuation should be made for portfolio investment(s). These valuation designee fair valuations will be based upon a significant amount
of Level 3 inputs.
The following is a summary of the inputs used to value the Funds' investments as of December 31, 2023, at value:
International Growth Fund
Asset Valuation Input
s
D
escr
i
pt
i
on
L
eve
l
1
L
eve
l
2
L
eve
l
3
T
ota
l
Common Stock
s
Australia
$
—
$
1,350,044
$
—
$
1,350,04
4
Belgium — 642,576 — 642,576
China 4
,574,661 2,237,142 — 6,811,803
D
enmark — 2,112,314 — 2,112,31
4
F
rance — 1,476,171 — 1,476,17
1
Germany — 1,064,521 — 1,064,52
1
J
apan — 1,117,814 — 1,117,814
M
acau — 246,438 — 246,438
N
et
h
er
l
an
d
s— 1,725,988 — 1,725,98
8
Switzerland 566,313 959,600 — 1,525,91
3
U
n
i
te
d
Ki
n
gd
om — 1,689,531 — 1,689,53
1
United
S
tates 3,222,210 2,809,754 — 6,031,964
All Other Common Stocks
(
a
)
4,179,567 — — 4,179,567
Total Common Stocks 12
,542,751 17,431,893 — 29,974,644
Short-Term Investments — 483,572 — 483,57
2
Total Investments
$
12,542,751
$
17,915,465
$
—
$
30,458,21
6
(a) Details of the major categories of the Fund’s investments are reflected within the Portfolio of Investments.
Notes to Financial Statements
(
continued
)
D
ecember 31, 2023
|
8
4

Natixis Oakmark Fund
Asset Valuation Inputs
D
escr
i
pt
i
on
L
eve
l
1
L
eve
l
2
L
eve
l
3
T
ota
l
Common Stocks(a)
$
603,664,726
$
—
$
—
$
603,664,726
Short-Term Investments — 32,116,607 — 32,116,60
7
Total Investments
$
603,664,726
$
32,116,607
$
—
$
635,781,333
(a) Details of the major categories of the Fund’s investments are reflected within the Portfolio of Investments.
Natixis Oakmark International Fund
Asset Valuation Inputs
D
escr
i
pt
i
on
L
eve
l
1
L
eve
l
2
L
eve
l
3
T
ota
l
Common Stock
s
Belgium
$
—
$
5,196,122
$
—
$
5,196,122
C
hina — 5,252,621 — 5,252,621
Denmark — 4,568,374 — 4,568,37
4
F
rance — 63,715,373 — 63,715,37
3
Germany — 99,870,801 — 99,870,80
1
I
n
dia
— 2,586,988 — 2,586,98
8
Indonesia — 582,539 — 582,539
I
ta
ly
—
9,220,
1
8
7—
9,220,
1
87
J
apan — 13,037,932 — 13,037,932
K
orea — 7,480,010 — 7,480,01
0
N
et
h
er
l
an
d
s— 18,212,154 — 18,212,154
Spain — 5,503,685 — 5,503,68
5
Sweden — 14,757,196 — 14,757,196
Switzerland — 31
,230,556 — 31,230,556
U
n
i
te
d
Ki
ng
d
om 3,890,972 68,863,505 — 72,754,477
All Other Common Stocks(a) 13
,057,859 — — 13,057,85
9
Total Common Stocks 16,948,831 350,078,043 — 367,026,874
Preferred Stocks(a) — 6,746,111 — 6,746,111
S
hort-Term Investments — 9,624,351 — 9,624,35
1
Total Investments
$
16,948,831
$
366,448,505
$
—
$
383,397,336
(a) Details of the major categories of the Fund’s investments are reflected within the Portfolio of Investments.
U.S. Equity Opportunities Fund
Asset Valuation Inputs
D
escr
ip
t
i
on
L
eve
l
1
L
eve
l
2
L
eve
l
3
T
ota
l
Common Stocks(a)
$
941,915,248
$
—
$
—
$
941,915,248
Short-Term Investments — 22
,287,241 — 22,287,24
1
Total Investments
$
941,915,248
$
22,287,241
$
—
$
964,202,489
(a) Details of the major categories of the Fund’s investments are reflected within the Portfolio of Investments.
Notes to Financial Statements
(
continued
)
December 31, 2023
85
|

Mid Cap Fund
Asset Valuation Inputs
D
escr
i
pt
i
on
L
eve
l
1
L
eve
l
2
L
eve
l
3
T
ota
l
Common Stocks(a)
$
247,520,222
$
—
$
—
$
247,520,22
2
Short-Term Investments — 1,751,872 — 1,751,872
Total Investments
$
247,520,222
$
1,751,872
$
—
$
249,272,094
(a) Details of the major categories of the Fund’s investments are reflected within the Portfolio of Investments.
Small Cap Value Fund
Asset Valuation Inputs
D
escr
i
pt
i
on
L
eve
l
1
L
eve
l
2
L
eve
l
3
T
ota
l
Common Stocks(a)
$
626,591,088
$
—
$
—
$
626,591,088
Short-Term Investments — 22
,593,629 — 22,593,62
9
Total Investments $ 626,591,088 $ 22,593,629 $ — $649,184,71
7
(a) Details of the major categories of the Fund’s investments are reflected within the Portfolio of Investments.
4. Purchases and Sales of Securities. For the year ended December 31, 2023, purchases and sales of securities (excluding short-term
investments) were as follows:
Fund Purchases Sale
s
International Growth Fund $ 2,394,395 $ 1,519,24
7
Natixis
O
akmark Fund 320,776,587 170,887,78
7
Natixis Oakmark International Fund 97,104,753 130,320,44
0
U.S. Equity Opportunities Fund 292,596,770 342,594,59
9
Mid
C
ap Fund 223,902,210 268,498,38
1
Small Cap Value Fund 604,428,522 240,083,388
5. Management Fees and Other Transactions with Affiliates.
a. Management Fees. Loomis, Sayles & Company, L.P. (“Loomis Sayles”) serves as investment adviser to International Growth Fund.
Loomis Sayles is a limited partnership whose sole general partner, Loomis, Sayles & Company, Inc., is indirectly owned by Natixis
Investment Managers, LLC, which is part of Natixis Investment Managers, an international asset management group based in Paris,
France.
Under the terms of the management agreement, International Growth Fund pays a management fee at the annual rate of 0.75%,
calculated daily and payable monthly, based on the Fund’s average daily net assets.
Natixis Advisors, LLC (“Natixis Advisors”) serves as investment adviser to Natixis Oakmark Fund, Natixis Oakmark International Fund,
U.S. Equity Opportunities Fund, Mid Cap Fund and Small Cap Value Fund. Under the terms of the management agreements, each Fund
pays a management fee at the following annual rates, calculated daily and payable monthly, based on each Fund’s average daily net
assets:
P
ercentage o
f
Average Daily Net Asset
s
F
un
d
Fi
rs
t
$
150 millio
n
N
ext
$
50 millio
n
N
ext
$
300 millio
n
N
ext
$
500 millio
n
N
ext
$
500 millio
n
O
ver
$
1.5 billio
n
Natixis Oakmark Fund 0.70
%
0.70
%
0.65
%
0.60
%
0.60
%
0.60
%
Natixis Oakmark International Fund 0.85% 0.75% 0.75% 0.75% 0.70% 0.70
%
U.S. Equity Opportunities Fund 0.67
%
0.67
%
0.67
%
0.67
%
0.67
%
0.67
%
Mid Cap Fund 0.75
%
0.75
%
0.75
%
0.75
%
0.75
%
0.70
%
Small Cap Value Fund 0.85
%
0.85
%
0.85
%
0.85
%
0.85
%
0.85
%
Notes to Financial Statements
(
continued
)
December 31, 2023
|
86

Prior to July 1, 2023, U.S. Equity Opportunities Fund paid a management fee at the annual rate of 0.70% of the Fund’s average daily net
assets, calculated daily and payable monthly.
Natixis Advisors has entered into subadvisory agreements for each Fund as listed below.
Natixis Oakmark Fund Harris
Associates L.P. (“Harris”)
Natixis Oakmark International Fund Harris
U.S. Equity Opportunities Fund Harris
Loomis Sayles
Mid Cap Fund Vaughan Nelson Investment Management, L.P. (“Vaughan Nelson”)
Small Cap Value Fund Vaughan Nelson
Natixis Advisors, Harris and Vaughan Nelson are subsidiaries of Natixis Investment Managers, LLC.
Under the terms of the subadvisory agreements, each Fund has agreed to pay its respective subadviser a subadvisory fee at the
following annual rates, calculated daily and payable monthly, based on each Fund’s average daily net assets:
P
ercentage of Average
Daily Net Asset
s
Fund
S
ubadviser
Fi
rs
t
$
150 millio
n
N
ext
$
50 millio
n
N
ex
t
$
800 millio
n
N
ext
$
500 millio
n
Over
$
1.5 billio
n
Natixis Oakmark Fund Harris 0.52
%
0.52
%
0.50
%
0.50
%
0.50
%
Natixis Oakmark International Fund Harris 0.60
%
0.50
%
0.50
%
0.45
%
0.45
%
U.S. Equity Opportunities Fund
Large Cap Value Segment Harris 0.51
%
0.51
%
0.51
%
0.51
%
0.51
%
All Cap Growth Segment Loomis Sayles 0.35
%
0.35
%
0.35
%
0.35
%
0.35
%
Mid Cap Fund Vaughan Nelson 0.47
%
0.47
%
0.47
%
0.47
%
0.44
%
Small Cap Value Fund Vaughan Nelson 0.52
%
0.52
%
0.52
%
0.52
%
0.52
%
Prior to July 1, 2023, U.S. Equity Opportunities Fund Large Cap Value Segment had paid its respective subadviser a subadvisory fee at
the following annual rates, calculated daily and payable monthly, based on the Fund’s average daily net assets:
P
ercentage o
f
Average
D
a
il
y
N
et
A
sset
s
Fund Subadvise
r
Fi
rs
t
$150 millio
n
N
ext
$50 millio
n
N
ex
t
$
800 millio
n
N
ext
$500 millio
n
Over
$
1.5 billio
n
U.S. Equity Opportunities Fund
Large Cap Value Segment Harris 0.52
% 0.52% 0.52% 0.52% 0.52%
Loomis Sayles and Natixis Advisors have given binding undertakings to the Funds to waive management fees and/or reimburse certain
expenses to limit the Funds’ operating expenses, exclusive of acquired fund fees and expenses, brokerage expenses, interest expense,
substitute dividend expenses on securities sold short, taxes, organizational and extraordinary expenses such as litigation and
indemnification expenses. These undertakings are in effect until April 30, 2024, except for U.S. Equity Opportunities Fund which is in
effect until April 30, 2025, may be terminated before then only with the consent of the Funds’ Board of Trustees, and are reevaluated on
an annual basis. Management fees payable, as reflected on the Statements of Assets and Liabilities, is net of waivers and/or expense
reimbursements, if any, pursuant to these undertakings. Waivers/reimbursements that exceed management fees payable are reflected
on the Statements of Assets and Liabilities as receivable from investment adviser.
Notes to Financial Statements
(
continued
)
D
ecember 31, 2023
87
|

For the year ended December 31, 2023, the expense limits as a percentage of average daily net assets under the expense limitation
agreements were as follows:
Expense Limit as a Percentage o
f
A
verage
D
a
ily
N
et
A
sset
s
Fund Class A Class CClass N Class
Y
International Growth Fund 1.20% 1.95% 0.90% 0.95
%
Natixis Oakmark Fund 1.05% 1.80% 0.75% 0.80
%
Natixis Oakmark International Fund 1.15% 1.90% 0.85% 0.90
%
U.S. Equity Opportunities Fund 1.12% 1.87% 0.82% 0.87
%
Mid Cap Fund 1.15
%
1.90
%
0.85
%
0.90
%
Small Cap Value Fund 1.25% 2.00% 0.95% 1.00
%
Prior to July 1, 2023, the expense limits as a percentage of average daily net assets under the expense limitation agreements for
U.S. Equity Opportunities Fund were as follows:
Expense Limit as a Percentage o
f
A
verage Daily Net Asset
s
Fund Class A Class C Class N Class
Y
U.S. Equity Opportunities Fund 1.15% 1.90% 0.85% 0.90
%
Loomis Sayles and Natixis Advisors shall be permitted to recover expenses borne under the expense limitation agreements (whether
through waiver of management fee or otherwise) on a class by class basis in later periods to the extent the annual operating expenses
of a class fall below both (1) a class’ expense limitation ratio in place at the time such amounts were waived/reimbursed and (2) a
class’ current applicable expense limitation ratio, provided, however, that a class is not obligated to pay such waived/reimbursed fees
or expenses more than one year after the end of the fiscal year in which the fees or expenses were waived/reimbursed.
For the year ended December 31, 2023, the management fees and waiver of management fees for each Fund were as follows:
G
ros
s
M
anagement
Fees
Contractual
W
aivers o
f
M
anagement
Fees
1
N
e
t
M
anagement
Fees
Percentage of
A
verage
D
aily Net Asset
s
Fu
n
d
Gross Ne
t
International Growth Fund
$
214,448
$
166,923
$
47,525 0.75% 0.17
%
Natixis Oakmark Fund 3,011,450 438,455 2,572,995 0.67
%
0.57
%
Natixis Oakmark International Fund 3,024,746 861,715 2,163,031 0.79% 0.56
%
U.S. Equity Opportunities Fund 5,769,710 — 5,769,710 0.68
%
0.68
%
Mid Cap Fund 1,868,542 204,159 1,664,383 0.75
%
0.67
%
Small Cap Value Fund 2,975,008 404,650 2,570,358 0.85% 0.73
%
1
Management fee waivers are subject to possible recovery until December 31, 2024.
No expenses were recovered for any of the Funds during the year ended December 31, 2023 under the terms of the expense limitation
agreements.
b. Service and Distribution Fees. Natixis Distribution, LLC (“Natixis Distribution"), which is a wholly-owned subsidiary of Natixis
Investment Managers, LLC, has entered into a distribution agreement with the Trusts. Pursuant to this agreement, Natixis Distribution
serves as principal underwriter of the Funds of the Trusts.
Pursuant to Rule 12b-1 under the 1940 Act, the Trusts have adopted a Service Plan relating to each Fund’s Class A shares (the “Class A
Plans”), a Distribution and Service Plan relating to each Fund’s Class C shares (the “Class C Plans”).
Under the Class A Plans, each Fund pays Natixis Distribution a monthly service fee at an annual rate not to exceed 0.25% of the
average daily net assets attributable to the Funds’ Class A shares, as reimbursement for expenses incurred by Natixis Distribution in
providing personal services to investors in Class A shares and/or the maintenance of shareholder accounts.
Under the Class C Plans, each Fund pays Natixis Distribution a monthly service fee at an annual rate not to exceed 0.25% of the
average daily net assets attributable to the Funds’ Class C shares, as compensation for services provided by Natixis Distribution in
providing personal services to investors in Class C shares and/or the maintenance of shareholder accounts.
Notes to Financial Statements
(
continued
)
D
ecember 31, 2023
|
88

Also under the Class C Plans, each Fund pays Natixis Distribution a monthly distribution fee at an annual rate of 0.75% of the average
daily net assets attributable to the Funds’ Class C shares, as compensation for services provided by Natixis Distribution in connection
with the marketing or sale of Class C shares.
For the year ended December 31, 2023, the service and distribution fees for each Fund were as follows:
Service Fees Distribution Fees
Fund Class A Class C Class C
International Growth Fund $ 348 $ 2 $
6
N
atixis Oakmark Fund 548,432 130,178 390,53
4
N
atixis Oakmark International Fund 343,505 88,014 264,04
2
U.S. Equity Opportunities Fund 1,409,846 74,698 224,09
3
Mid
C
ap Fund 85,732 14,555 43,66
2
Small Cap Value Fund 211,518 10,995 32,986
c. Administrative Fees. Natixis Advisors provides certain administrative services for the Funds and contracts with State Street Bank
and Trust Company (“State Street Bank”) to serve as sub-administrator. Pursuant to an agreement among Natixis Funds Trusts, Loomis
Sayles Funds Trusts, Natixis ETF Trusts and Natixis Advisors, each Fund pays Natixis Advisors monthly its pro rata portion of fees equal
to an annual rate of 0.0540% of the first $15 billion of the average daily net assets of the Natixis Funds Trusts, Loomis Sayles Funds
Trusts and Natixis ETF Trusts, 0.0500% of the next $15 billion, 0.0400% of the next $30 billion, 0.0275% of the next $30 billion and 0.0225%
of such assets in excess of $90 billion, subject to an annual aggregate minimum fee for the Natixis Funds Trusts, Loomis Sayles Funds
Trusts and Natixis ETF Trusts of $10 million, which is reevaluated on an annual basis.
For the year ended December 31, 2023, the administrative fees for each Fund were as follows:
F
un
d
Ad
m
i
n
i
strat
i
v
e
F
ee
s
International Growth Fund $ 13,24
5
Natixis Oakmark Fund 207,87
4
Natixis Oakmark International Fund 177,53
2
U.S. Equity Opportunities Fund 390,70
5
Mid
C
ap Fund 115,39
9
Small Cap Value Fund 162,07
3
d. Sub-Transfer Agent Fees. Natixis Distribution has entered into agreements, which include servicing agreements, with financial
intermediaries that provide recordkeeping, processing, shareholder communications and other services to customers of the
intermediaries that hold positions in the Funds and has agreed to compensate the intermediaries for providing those services.
Intermediaries transact with the Funds primarily through the use of omnibus accounts on behalf of their customers who hold positions
in the Funds. These services would have been provided by the Funds’ transfer agent and other service providers if the shareholders’
accounts were maintained directly at the Funds’ transfer agent. Accordingly, the Funds have agreed to reimburse Natixis Distribution
for all or a portion of the servicing fees paid to these intermediaries. The reimbursement amounts (sub-transfer agent fees) paid to
Natixis Distribution are subject to a current per-account equivalent fee limit approved by the Funds’ Board of Trustees, which is based
on fees for similar services paid to the Funds’ transfer agent and other service providers. Class N shares do not bear such expenses.
For the year ended December 31, 2023, the sub-transfer agent fees (which are reflected in transfer agent fees and expenses in the
Statements of Operations) for each Fund were as follows:
F
un
d
Sub-Transfe
r
A
gent
F
ee
s
International Growth Fund
$
3,313
Natixis Oakmark Fund 242
,490
Natixis Oakmark International Fund 622
,04
6
U.S. Equity Opportunities Fund 309,32
6
Mid
C
ap Fund 163,466
Small Cap Value Fund 307,27
2
Notes to Financial Statements
(
continued
)
D
ecember 31, 2023
8
9
|

As of December 31, 2023, the Funds owe Natixis Distribution the following reimbursements for sub-transfer agent fees (which are
reflected in the Statements of Assets and Liabilities as payable to distributor):
F
un
d
R
e
i
m
b
ursement
s
o
f Sub-Transfer
A
gent
F
ee
s
International Growth Fund
$
4
0
Natixis Oakmark Fund 2,92
5
Natixis
O
akmark International Fund 6,45
3
U.S. Equity Opportunities Fund 3,64
2
Mid Cap Fund 1,636
Small Cap Value Fund 3,560
Sub-transfer agent fees attributable to Class A, Class C and Class Y are allocated on a pro rata basis to each class based on the
relative net assets of each class to the total net assets of those classes.
e. Commissions. Commissions (including CDSCs) on Fund shares retained by Natixis Distribution during the year ended December 31,
2023 were as follows:
Fund Commissions
Natixis Oakmark Fund
$
54,58
3
Natixis
O
akmark International Fund 6,51
9
U.S. Equity Opportunities Fund 15,65
0
Mid Cap Fund 92
9
Small Cap Value Fund 9,09
8
f. Trustees Fees and Expenses. The Trusts do not pay any compensation directly to their officers or Trustees who are directors,
officers or employees of Natixis Advisors, Natixis Distribution, Natixis Investment Managers, LLC or their affiliates. The Chairperson of
the Board of Trustees receives a retainer fee at the annual rate of $369,000. The Chairperson does not receive any meeting attendance
fees for Board of Trustees meetings or committee meetings that he attends. Each Independent Trustee (other than the Chairperson)
receives, in the aggregate, a retainer fee at the annual rate of $210,000. Each Independent Trustee also receives a meeting attendance
fee of $10,000 for each meeting of the Board of Trustees that he or she attends in person and $5,000 for each meeting of the Board of
Trustees that he or she attends telephonically. In addition, the chairperson of the Contract Review Committee, the chairperson of the
Audit Committee and the chairperson of the Governance Committee each receive an additional retainer fee at the annual rate of
$20,000. Each Contract Review Committee member is compensated $6,000 for each Committee meeting that he or she attends in person
and $3,000 for each meeting that he or she attends telephonically. Each Audit Committee member is compensated $6,000 for each
Committee meeting that he or she attends in person and $3,000 for each meeting that he or she attends telephonically. Each
Governance Committee member is compensated $2,500 for each Committee meeting that he or she attends either in person or
telephonically. These fees are allocated among the funds in the Natixis Funds Trusts, Loomis Sayles Funds Trusts and Natixis ETF Trusts
based on a formula that takes into account, among other factors, the relative net assets of each fund. Trustees are reimbursed for
travel expenses in connection with attendance at meetings.
Effective January 1, 2024, the Chairperson of the Board of Trustees will receive a retainer fee at the annual rate of $385,000 and each
Independent Trustee (other than the Chairperson) will receive, in the aggregate, a retainer fee at the annual rate of $225,000. Each
Independent Trustee will receive a meeting attendance fee of $10,000 for each meeting of the Board of Trustees that he or she attends
in person. The chairperson of the Contract Review Committee and the chairperson of the Audit Committee each will receive an
additional retainer fee at the annual rate of $25,000. All other Trustees fees will remain unchanged.
A deferred compensation plan (the “Plan”) is available to the Trustees on a voluntary basis. The value of a participating Trustee’s
deferral account is based on theoretical investments of deferred amounts, on the normal payment dates, in certain funds of the Natixis
Funds Trusts, Loomis Sayles Funds Trusts and Natixis ETF Trusts as designated by the participating Trustees. Changes in the value of
participants’ deferral accounts are allocated pro rata among the funds in the Natixis Funds Trusts, Loomis Sayles Funds Trusts and
Natixis ETF Trusts and are normally reflected as Trustees’ fees and expenses in the Statements of Operations. Deferred amounts
remain in the funds until distributed in accordance with the provisions of the Plan. The portions of the accrued obligations allocated to
the Funds under the Plan are reflected as Deferred Trustees’ fees in the Statements of Assets and Liabilities.
Certain officers and employees of Natixis Advisors, Loomis Sayles and affiliates are also officers and/or Trustees of the Trusts.
Notes to Financial Statements
(
continued
)
D
ecember 31, 2023
|
9
0

g. Affiliated Ownership. As of December 31, 2023, Natixis and affiliates held shares of International Growth Fund representing 99.39%
of the Fund's net assets.
Investment activities of affiliated shareholders could have material impacts on the Fund.
h. Reimbursement of Transfer Agent Fees and Expenses. Natixis Advisors has given a binding contractual undertaking to the Funds to
reimburse any and all transfer agency expenses for the Funds’ Class N shares. This undertaking is in effect through April 30, 2024 and is
not subject to recovery under the expense limitation agreement described above.
For the year ended December 31, 2023, Natixis Advisors reimbursed the Funds for transfer agency expenses as follows:
Reimbursement o
f
Trans
f
er Agency
E
xpense
s
Fund Class N
International Growth Fund
$
1,23
0
N
atixis Oakmark Fund 1,23
5
N
atixis Oakmark International Fund 1,26
8
U.S. Equity Opportunities Fund 1,22
5
Mid Cap Fund 1,45
1
Small Cap Value Fund 1,323
6. Class-Specific Transfer Agent Fees and Expenses. Transfer agent fees and expenses attributable to Class A, Class C and Class Y
are allocated on a pro rata basis to each class based on the relative net assets of each class to the total net assets of those classes.
Transfer agent fees and expenses attributable to Class N are allocated to Class N.
For the year ended December 31, 2023, the Funds incurred the following class-specific transfer agent fees and expenses (including
sub-transfer agent fees, where applicable):
T
ransfer Agent Fees and Expense
s
Fund Class A Class C Class N Class Y
International Growth Fund
$
209
$
1
$
1,230
$
6,790
Natixis Oakmark Fund 182
,383 43,516 1,235 144,55
9
Natixis
O
akmark International Fund 235,089 60,050 1,268 359,94
2
U.S. Equity Opportunities Fund 380,369 20,209 1,225 166,47
9
Mid Cap Fund 34,484 5,850 1,451 143,94
8
Small Cap Value Fund 91,425 4,845 1,323 286,298
7. Line of Credit. Each Fund, together with certain other funds of Natixis Funds Trusts, Loomis Sayles Funds Trusts and Natixis ETF
Trusts, entered into a syndicated, revolving, committed, unsecured line of credit with State Street Bank as administrative agent. The
aggregate revolving commitment amount is $575,000,000. Any one Fund may borrow up to $402,500,000 under the line of credit
agreement (as long as all borrowings by all Funds in the aggregate do not exceed the $575,000,000 limit at any time), subject to each
Fund’s investment restrictions and its contractual obligations under the line of credit. Interest is charged to the Funds based upon the
terms set forth in the agreement. In addition, a commitment fee of 0.15% per annum, payable at the end of each calendar quarter, is
accrued and apportioned among the participating funds based on their average daily unused portion of the line of credit. The Funds
paid certain legal fees in connection with the line of credit agreement, which are being amortized over a period of 364 days and are
reflected in legal fees on the Statements of Operations. The unamortized balance is reflected as prepaid expenses on the Statements
of Assets and Liabilities.
Prior to April 6, 2023, each Fund, together with certain other funds of Natixis Funds Trusts and Loomis Sayles Funds Trusts and Natixis
ETF Trusts, entered into a $500,000,000 committed unsecured line of credit provided by State Street Bank. Any one Fund was able to
borrow up to $350,000,000 under the line of credit agreement (as long as all borrowings by all Funds in the aggregate did not exceed the
$500,000,000 limit at any time), subject to each Fund’s investment restrictions and its contractual obligations under the line of credit.
Interest was charged to the Funds based upon the terms set forth in the agreement. In addition, a commitment fee of 0.15% per annum,
payable at the end of each calendar quarter, was accrued and apportioned among the participating funds based on their average daily
unused portion of the line of credit.
Notes to Financial Statements
(
continued
)
D
ecember 31, 2023
9
1
|

For the year ended December 31, 2023, U.S. Equity Opportunities Fund had an average daily balance on the line of credit (for those days
on which there were borrowings) of $2,850,000 at a weighted average interest rate of 5.43%. Interest expense incurred on the line of
credit was $1,720.
8. Risk. The Funds’ investments in foreign securities may be subject to greater political, economic, environmental, credit/counterparty
and information risks. The Fund's investments in foreign securities also are subject to foreign currency fluctuations and other foreign
currency-related risks. Foreign securities may be subject to higher volatility than U.S. securities, varying degrees of regulation and
limited liquidity.
International Growth Fund may invest to a significant extent in variable interest entity (“VIE”) structures. VIE structures can vary, but
generally consist of a U.S.-listed company with contractual arrangements, through one or more wholly-owned special purpose
vehicles, with a Chinese company that ultimately provides the U.S.-listed company with contractual rights to obtain economic benefits
from the Chinese company. The VIE structure enables foreign investors, such as the Fund, to obtain investment exposure similar to that
of an equity owner in a Chinese company in situations in which the Chinese government has restricted or prohibited the ownership of
such company by foreign investors. The Fund’s exposure to VIE structures may pose additional risks because the VIE structure is not
formally recognized under Chinese law. The Chinese government may cease to tolerate VIE structures at any time or impose new
restrictions. In addition, Chinese companies using the VIE structure, and listed on stock exchanges in the U.S., could also face delisting
or other ramifications for failure to meet the expectations and/or requirements of the U.S. Securities and Exchange Commission, the
Public Company Accounting Oversight Board, or other U.S. regulators. Any of these risks could reduce the liquidity and value of these
investments or render them valueless.
International Growth Fund is non-diversified, which means that it is not limited under the 1940 Act to a percentage of assets that it may
invest in any one issuer. Because the Fund may invest in the securities of a limited number of issuers, an investment in the Fund may
involve a higher degree of risk than would be present in a diversified portfolio.
Geopolitical events (such as trading halts, sanctions or wars) could increase volatility and uncertainty in the financial markets and
adversely affect regional and global economies. These, and other related events, could significantly impact a Fund's performance and
the value of an investment in the Fund, even if the Fund does not have direct exposure to issuers in the country or countries involved.
9. Concentration of Ownership. From time to time, a Fund may have a concentration of one or more accounts constituting a
significant percentage of shares outstanding. Investment activities by holders of such accounts could have material impacts on the
Funds. As of December 31, 2023, based on management’s evaluation of the shareholder account base, the Funds had accounts
representing controlling ownership of more than 5% of the Funds’ total outstanding shares. The number of such accounts, based on
accounts that represent more than 5% of an individual class of shares, and the aggregate percentage of net assets represented by
such holdings were as follows:
Fu
n
d
Number of 5
%
Accou
nt
Holde
rs
Percentage o
f
Ownershi
p
Natixis Oakmark Fund 1 6.68%
Natixis Oakmark International Fund 1 23.83
%
U.S. Equity Opportunities Fund 1 6.59
%
Mid Cap Fund 2 23.77
%
Omnibus shareholder accounts for which Natixis Advisors understands that the intermediary has discretion over the underlying
shareholder accounts or investment models where a shareholder account may be invested for a non-discretionary customer are
included in the table above. For other omnibus accounts, the Funds do not have information on the individual shareholder accounts
underlying the omnibus accounts; therefore, there could be other 5% shareholders in addition to those disclosed in the table above.
Notes to Financial Statements
(
continued
)
D
ecember 31, 2023
|
9
2

10. Capital Shares. Each Fund may issue an unlimited number of shares of beneficial interest, without par value. Transactions in
capital shares were as follows:
Yea
r
E
n
ded
D
ecem
b
er 31, 2023
Yea
r
E
n
ded
D
ecem
b
er 31, 202
2
International Growth Fund Shares Amount Shares Amount
C
lass
A
Issued from the sale of shares 2,503
$
21,700 4,118
$
33,249
Issued in connection with the reinvestment o
f
distributions 54 506 71 565
Redeemed
(
2,485
)(
22,346
)
——
Net change 72
$
(140) 4,189
$
33,814
C
lass
C
Redeemed —
$
— (3,928)
$
(33,853
)
Net change —
$
— (3,928)
$
(33,853
)
C
lass
N
Issued from the sale of shares —
$
— 319,693
$
2,500,000
Issued in connection with the reinvestment o
f
distributions 1,970 18,612 2,314 18,35
1
Net change 1,970
$
18,612 322,007
$
2,518,35
1
C
lass Y
Issued from the sale of shares 119,836
$
1,017,450 374,914
$
3,190,41
8
Issued in connection with the reinvestment o
f
distributions 2,930 27,691 2,707 21,46
9
Redeemed
(
246
)(
2,169
)(
2,822
)(
20,300
)
Net change 122,520
$
1,042,972 374,799
$
3,191,58
7
Increase from capital share transactions 124,562
$
1,061,444 697,067
$
5,709,899
Notes to Financial Statements
(
continued
)
D
ecember 31, 2023
9
3 |

10. Capital Shares (continued)
.
Year Ended
December 31, 2023
Year Ended
December 31, 2022
Natixis Oakmark Fund Shares Amount Shares Amount
Class A
Issued from the sale of shares 1,386,710 $ 35,188,050 1,251,455 $ 32,636,811
Issued in connection with the reinvestment of distributions 293,448 8,029,053 1,168,653 25,751,399
Redeemed (1,187,356)(29,357,878)(1,134,294)(28,656,218)
Net change 492,802 $ 13,859,225 1,285,814 $ 29,731,992
Class C
Issued from the sale of shares 528,152 $ 10,385,091 1,217,488 $ 26,738,602
Issued in connection with the reinvestment of distributions 93,146 1,956,916 492,676 8,476,261
Redeemed (1,055,818)(19,902,093)(734,433)(14,940,011)
Net change (434,520) $ (7,560,086) 975,731 $ 20,274,852
Class N
Issued from the sale of shares 288 $ 7,742 58 $ 1,547
Issued in connection with the reinvestment of distributions 750 22,322 3,064 73,284
Redeemed (1,348) (36,140)(2,888)(81,794)
Net change (310) $ (6,076) 234 $ (6,963)
Class Y
Issued from the sale of shares 9,451,057 $262,547,873 6,361,056 $ 191,465,914
Issued in connection with the reinvestment of distributions 365,614 10,843,953 638,488 15,388,143
Redeemed (3,282,300)(89,337,801)(5,757,253)(154,617,312)
Net change 6,534,371 $184,054,025 1,242,291 $ 52,236,745
Increase from capital share transactions 6,592,343 $190,347,088 3,504,070 $ 102,236,626
Notes to Financial Statements
(
continued
)
D
ecember 31, 202
3
|
9
4

10. Capital Shares (continued)
.
Year Ended
December 31, 2023
Year Ended
December 31, 2022
Natixis Oakmark International Fund Shares Amount Shares Amount
Class A
Issued from the sale of shares 1,688,085 $ 24,175,449 2,081,450 $ 27,188,627
Issued in connection with the reinvestment of distributions 108,110 1,581,529 108,247 1,369,329
Redeemed (1,648,201) (23,381,209)(2,674,538)(34,233,303)
Net change 147,994 $ 2,375,769 (484,841) $ (5,675,347)
Class C
Issued from the sale of shares 71,240 $ 1,010,015 146,028 $ 1,872,215
Issued in connection with the reinvestment of distributions 13,933 200,718 23,961 297,840
Redeemed (1,287,224) (17,896,948)(1,650,271)(21,038,433)
Net change (1,202,051) $ (16,686,215) (1,480,282) $ (18,868,378)
Class N
Issued from the sale of shares 11,185 $ 143,685 145,580 $ 2,017,090
Issued in connection with the reinvestment of distributions 470 6,845 363 4,576
Redeemed (5,566)(78,203)(174,806)(2,201,343)
Net change 6,089 $ 72,327 (28,863) $ (179,677)
Class Y
Issued from the sale of shares 3,217,650 $ 45,697,023 7,667,504 $ 104,077,801
Issued in connection with the reinvestment of distributions 275,316 4,005,582 303,265 3,815,073
Redeemed (4,671,698)(65,499,977)(12,663,967)(169,927,755)
Net change (1,178,732) $ (15,797,372) (4,693,198) $ (62,034,881)
Decrease from capital share transactions (2,226,700) $ (30,035,491) (6,687,184) $ (86,758,283)
Notes to Financial Statements
(
continued
)
D
ecember 31, 202
3
9
5
|

10. Capital Shares (continued)
.
Year Ended
December 31, 2023
Year Ended
December 31, 2022
U.S. Equity Opportunities Fund Shares Amount Shares Amount
Class A
Issued from the sale of shares 678,253 $ 23,509,035 682,513 $ 23,765,153
Issued in connection with the reinvestment of distributions 1,204,004 43,870,647 2,458,392 77,467,012
Redeemed (2,864,385)(97,156,248)(2,488,264)(85,464,740)
Net change (982,128) $ (29,776,566) 652,641 $ 15,767,425
Class C
Issued from the sale of shares 227,231 $ 3,297,014 188,655 $ 3,147,013
Issued in connection with the reinvestment of distributions 391,003 5,254,512 731,774 10,169,356
Redeemed (782,585)(11,000,049)(1,134,470)(19,010,339)
Net change (164,351) $ (2,448,523) (214,041) $ (5,693,970)
Class N
Issued from the sale of shares — $ — 721 $ 30,208
Issued in connection with the reinvestment of distributions 285 13,778 516 20,693
Redeemed (129)(6,250)(72)(2,729)
Net change 156 $ 7,528 1,165 $ 48,172
Class Y
Issued from the sale of shares 2,819,571 $ 126,397,035 1,826,215 $ 81,090,815
Issued in connection with the reinvestment of distributions 289,349 13,935,793 558,904 22,817,734
Redeemed (1,576,769)(68,998,499)(2,555,340)(108,147,485)
Net change 1,532,151 $ 71,334,329 (170,221) $ (4,238,936)
Increase from capital share transactions 385,828 $ 39,116,768 269,544 $ 5,882,691
Notes to Financial Statements
(
continued
)
D
ecember 31, 202
3
|
9
6

10. Capital Shares (continued)
.
Year Ended
December 31, 2023
Year Ended
December 31, 2022
Mid Cap Fund Shares Amount Shares Amount
Class A
Issued from the sale of shares 258,724 $ 5,272,975 254,188 $ 5,207,282
Issued in connection with the reinvestment of distributions 5,113 115,653 47,991 1,002,920
Redeemed (262,211)(5,316,615)(263,346)(5,258,953)
Net change 1,626 $ 72,013 38,833 $ 951,249
Class C
Issued from the sale of shares 9,970 $ 179,835 41,957 $ 749,400
Issued in connection with the reinvestment of distributions — — 13,437 257,591
Redeemed (248,936) (4,556,274)(193,780)(3,552,548)
Net change (238,966) $ (4,376,439) (138,386) $ (2,545,557)
Class N
Issued from the sale of shares 187,046 $ 3,875,585 157,734 $ 3,317,147
Issued in connection with the reinvestment of distributions 15,982 367,265 125,027 2,643,594
Redeemed (1,089,884)(22,347,940)(599,530)(12,583,501)
Net change (886,856) $ (18,105,090) (316,769) $ (6,622,760)
Class Y
Issued from the sale of shares 829,941 $ 17,124,756 994,932 $ 20,936,431
Issued in connection with the reinvestment of distributions 32,188 741,295 271,832 5,776,106
Redeemed (2,066,677)(42,974,174)(3,661,665)(76,714,966)
Net change (1,204,548) $ (25,108,123) (2,394,901) $ (50,002,429)
Decrease from capital share transactions (2,328,744) $ (47,517,639) (2,811,223) $ (58,219,497)
Notes to Financial Statements
(
continued
)
D
ecember 31, 202
3
9
7
|

10. Capital Shares (continued)
.
Year Ended
December 31, 2023
Year Ended
December 31, 2022
Small Cap Value Fund Shares Amount Shares Amount
Class A
Issued from the sale of shares 2,230,090 $ 37,758,332 294,742 $ 4,937,363
Issued in connection with the reinvestment of distributions 16,125 304,663 238,814 3,785,851
Redeemed (725,916)(11,990,865)(720,255)(11,602,583)
Net change 1,520,299 $ 26,072,130 (186,699) $ (2,879,369)
Class C
Issued from the sale of shares 928,672 $ 5,506,114 269,996 $ 1,616,908
Issued in connection with the reinvestment of distributions 10,392 67,551 43,643 240,247
Redeemed (111,787)(644,754)(53,628)(323,660)
Net change 827,277 $ 4,928,911 260,011 $ 1,533,495
Class N
Issued from the sale of shares 34,826 $ 619,155 16,766 $ 293,058
Issued in connection with the reinvestment of distributions 599 12,034 4,642 77,738
Redeemed (3,357)(58,720)(1,959)(31,168)
Net change 32,068 $ 572,469 19,449 $ 339,628
Class Y
Issued from the sale of shares 23,399,247 $422,571,046 5,751,752 $ 96,719,232
Issued in connection with the reinvestment of distributions 114,571 2,299,448 313,912 5,212,202
Redeemed (4,609,145)(82,075,612)(2,083,989)(35,666,627)
Net change 18,904,673 $342,794,882 3,981,675 $ 66,264,807
Increase from capital share transactions 21,284,317 $374,368,392 4,074,436 $ 65,258,561
Notes to Financial Statements
(
continued
)
D
ecember 31, 202
3
|
9
8
To the Boards of Trustees of Loomis Sayles Funds II, Natixis Funds Trust I and Natixis Funds Trust II and Shareholders of Loomis Sayles
International Growth Fund, Natixis Oakmark International Fund, Natixis U.S. Equity Opportunities Fund, Vaughan Nelson Small Cap
Value Fund, Natixis Oakmark Fund and Vaughan Nelson Mid Cap Fund
Opinions on the Financial Statements
We have audited the accompanying statements of assets and liabilities, including the portfolios of investments, of Loomis Sayles
International Growth Fund (one of the funds constituting Loomis Sayles Funds II), Natixis Oakmark International Fund, Natixis
U.S. Equity Opportunities Fund and Vaughan Nelson Small Cap Value Fund (three of the funds constituting Natixis Funds Trust I), and
Natixis Oakmark Fund and Vaughan Nelson Mid Cap Fund (two of the funds constituting Natixis Funds Trust II) (hereafter collectively
referred to as the "Funds") as of December 31, 2023, the related statements of operations for the year ended December 31, 2023, the
statements of changes in net assets for each of the two years in the period ended December 31, 2023, including the related notes, and
the financial highlights for each of the periods indicated therein (collectively referred to as the “financial statements”). In our opinion,
the financial statements present fairly, in all material respects, the financial position of each of the Funds as of December 31, 2023, the
results of each of their operations for the year then ended, the changes in each of their net assets for each of the two years in the
period ended December 31, 2023 and each of the financial highlights for each of the periods indicated therein, in conformity with
accounting principles generally accepted in the United States of America.
Basis for Opinions
These financial statements are the responsibility of the Funds’ management. Our responsibility is to express an opinion on the Funds’
financial statements based on our audits. We are a public accounting firm registered with the Public Company Accounting Oversight
Board (United States) (PCAOB) and are required to be independent with respect to the Funds in accordance with the U.S. federal
securities laws and the applicable rules and regulations of the Securities and Exchange Commission and the PCAOB.
We conducted our audits of these financial statements in accordance with the standards of the PCAOB. Those standards require that
we plan and perform the audit to obtain reasonable assurance about whether the financial statements are free of material
misstatement, whether due to error or fraud.
Our audits included performing procedures to assess the risks of material misstatement of the financial statements, whether due to
error or fraud, and performing procedures that respond to those risks. Such procedures included examining, on a test basis, evidence
regarding the amounts and disclosures in the financial statements. Our audits also included evaluating the accounting principles used
and significant estimates made by management, as well as evaluating the overall presentation of the financial statements. Our
procedures included confirmation of securities owned as of December 31, 2023 by correspondence with the custodian and brokers;
when replies were not received from brokers, we performed other auditing procedures. We believe that our audits provide a
reasonable basis for our opinions.
/s/PricewaterhouseCoopers LLP
Boston, Massachusetts
February 22, 2024
We have served as the auditor of one or more investment companies in Natixis Investment Company Complex since at least 1995. We
have not been able to determine the specific year we began serving as auditor.
Report of Independent Registered Public Accounting Firm
99
|

2023 U.S.Tax Distribution Information to Shareholders (Unaudited)
Corporate Dividends Received Deduction. For the fiscal year ended December 31, 2023, a percentage of dividends distributed by the
Funds listed below qualify for the dividends received deduction for corporate shareholders. These percentages are as follows:
F
und
Q
ualifyin
g
P
ercentage
International Growth Fund 4.26
%
Natixis Oakmark Fund 100.00
%
U.S. Equity Opportunities Fund 33.79
%
Mid Cap Fund 100.00%
Small Cap Value Fund 100.00
%
Qualified Dividend Income. For the fiscal year ended December 31, 2023, a percentage of the ordinary income dividends paid by the
Funds are considered qualified dividend income eligible for reduced tax rates. These lower rates range from 0% to 20% depending on
an individual’s tax bracket. If the Funds paid a distribution during calendar year 2023, complete information will be reported in
conjunction with Form 1099-DIV. These percentages are noted below:
Fu
n
d
Q
ualifyin
g
P
ercentage
International Growth Fund 100.00
%
Natixis Oakmark Fund 100.00
%
Natixis Oakmark International Fund 100.00
%
U.S. Equity Opportunities Fund 34.61
%
Mid Cap Fund 100.00
%
Small Cap Value Fund 100.00%
Capital Gains Distributions. Pursuant to Internal Revenue Section 852(b), the following Funds paid distributions, which have been
designated as capital gains distributions for the fiscal year ended December 31, 2023.
F
un
dA
mount
Natixis Oakmark Fund
$
18,473,24
3
U.S. Equity Opportunities Fund 44,583,93
4
Foreign Tax Credit. For the year ended December 31, 2023, the Fund intends to pass through foreign tax credits and have derived gross
income from sources within foreign countries amounting to:
F
un
d
F
ore
ig
n-
T
a
x
Credit Pass-Throug
h
F
oreign Sourc
e
I
ncome
International Growth Fund
$
45,364
$
470,047
Natixis Oakmark International Fund 212
,801 12,142,24
1
|
100

The tables below provide certain information regarding the Trustees and officers of Natixis Funds Trust I, Natixis Funds Trust II, and
L oomis Sayles Funds II (the “Trusts”). Unless otherwise indicated, the address of all persons below is 888 Boylston Street, Suite 800,
Boston, MA 02199-8197. The Funds' Statements of Additional Information include additional information about the Tr ustees of the
Trusts and are available by calling Natixis Funds at 800-225-5478.
Name and Year of Bir th
Position(s) Held with
the Trusts, Length
of Time Served and
Term of Office
1
Principal
Occupation(s)
During Past 5 Years
Number of Portfolios
in Fund Complex
Overseen
2
and Other
Directorships Held
During Past 5 Years
Experience,
Qualifications,
Attributes, Skills for
Board Membership
INDEPENDENT TRUSTEES
Edmond J. English
(1953)
Trustee since 2013
Contract Review
Committee Member
Executive Chairman of
Bob’ s Discount
Furniture (retail)
51
Director, Burlington
Stores, Inc. (retail);
Director, Rue La La
(e-commerce retail)
Significant experience
on the Board and on the
boards of other business
organizations (including
retail companies and a
bank); executive
experience (including at
a retail company)
Richard A. Goglia
(1951)
Trustee since 2015
Chairperson of the
Audit Committee
Retired 51
Former ly, Director of
Triumph Group
(aerospace industry)
Significant experience
on the Board and
executive experience
(including his role as
Vice President and
treasurer of a defense
company and experience
at a financial services
company)
Martin T. Meehan
(1956)
Trustee since 2012
Chairperson of the
Governance Committee
and
Contract Review
Committee Member
President, University of
Massachusetts
51
None
Significant experience
on the Board and on the
boards of other business
organizations;
experience as President
of the University of
Massachusetts;
government experience
(including as a member
of the U.S. House of
Representatives);
academic experience
Maureen B. Mitchell
(1951)
Trustee since 2017
Chairperson of the
Contract Review
Committee
Retired 51
Director, Sterling
Bancorp (bank)
Significant experience
on the Board; financial
services industry and
executive experience
(including role as
President of global sales
and marketing at a
financial services
company)
Trustee and Officer Information
1
01
|

Name an
d
Year o
f
Birt
h
P
osition(s) Held with
the Trusts, Len
g
th
of Time Served an
d
T
erm of Office
1
P
rincipal
O
ccupation
(
s
)
During Past 5 Years
Nu
mber ofPortfolios
i
n Fund Comple
x
O
versee
n
2
andOthe
r
Directorships He
ld
D
uring Past 5 Years
Ex
perience,
Q
ualifications,
A
ttributes, Skills fo
r
Board Membershi
p
INDEPENDENT TRUSTEES − continue
d
James P. Palermo
(1955)
Trustee since 2016
Audit Committee
Member and
Governance
Committee
Member
Founding Partner,
Breton Capital
Management, LLC
(private equity);
formerly, Partner, STEP
Partners, LLC (private
equity)
51
Director, Candidly
(chemicals and biofuels)
Significant experience
on the Board; financial
services industry and
executive experience
(including roles as Chief
Executive Officer of
client management and
asset servicing for a
banking and financial
services company)
Erik R. Sirri
(1958)
Chairperson of the
Board
of Trustees since 2021
Trustee since 2009
M b f Ex Officio em er o
the
Audit Committee,
Contract Review
Committee and
Governance Committee
Retired; formerly,
Professor of Finance at
Babson College
51
None
Significant experience
on the Board; experience
as Director of the
Division of Trading and
Markets at the
Securities and Exchange
Commission; academic
experience; training as
an economist
Peter J. Smail
(1952)
Trustee since 2009
Contract Review
Committee
Member
Retired 51
None
Significant experience
on the Board; mutual
fund industry and
executive experience
(including roles as
President and Chief
Executive Officer for an
investment adviser)
T
rustee and Officer Information
|
10
2

Name an
d
Year o
f
Birt
h
P
osition(s) Held with
the Trusts, Len
g
th
of Time Served an
d
T
erm of Office
1
P
rincipal
O
ccupation
(
s
)
During Past 5 Years
Nu
mber ofPortfolios
i
n Fund Comple
x
O
versee
n
2
andOthe
r
Directors
h
ips He
ld
D
uring Past 5 Years
Ex
perience,
Q
ualifications,
A
ttributes
,
Skills fo
r
Board Membershi
p
INDEPENDENT TRUSTEES − continue
d
Kirk A. Sykes
(1958)
Trustee since 2019
Audit Committee
Member and
Governance
Committee Member
Managing Director of
Accordia Partners, LLC
(real estate
development); President
of Primary Corporation
(real estate
development);
Managing Principal of
Merrick Capital
Partners (infrastructure
finance)
51
Advisor/Risk
Management
Committee, Eastern
Bank (bank); Director,
Apartment Investment
and Management
Company (real estate
investment trust);
formerly, Director, Ares
Commercial Real Estate
Corporation (real estate
investment trust)
Experience on the Board
and significant
experience on the boards
of other business
organizations (including
real estate companies
and banks)
Cynthia L. Walker
(1956)
Trustee since 2005
Audit Committee
and Governance
Committee Member
Retired; formerly,
Deputy Dean for
Finance and
Administration, Yale
University School of
Medicine
51
None
Significant experience
on the Board; executive
experience in a variety of
academic organizations
(including roles as dean
for finance and
administration)
INTERESTED TRUSTEES
Kevin P. Charleston
3
(1965)
One Financial Center
Boston, MA 02111
Trustee since 2015 President, Chief
Executive Officer and
Chairman of the Board
of Directors, Loomis,
Sayles & Company, L.P.
51
None
Significant experience
on the Board;
continuing service as
President, Chief
Executive Officer and
Chairman of the Board
of Directors of Loomis,
Sayles & Company, L.P.
T
rustee and Officer Information
1
03
|

Name an
d
Year o
f
Birt
h
P
osition(s) Held with
the Trusts, Len
g
th
of Time Served an
d
T
erm of Office
1
P
rincipal
O
ccupation
(
s
)
During Past 5 Years
Nu
mber ofPortfolios
i
n Fund Comple
x
O
versee
n
2
andOthe
r
Directors
h
ips He
ld
D
uring Past 5 Years
Ex
perience,
Q
ualifications,
A
ttributes
,
Skills fo
r
Board Membershi
p
INTERESTED TRUSTEES − continue
d
David L. Giunta
4
(1965)
Trustee since 2011
President and Chief
Executive Officer of
Natixis Funds Trust I
and
Natixis Funds Trust II
since 2008; President of
Loomis Sayles Funds II
since 2008; Chief
Executive Officer of
Loomis Sayles Funds II
since 2015
President and Chief
Executive Officer,
Natixis Advisors, LLC
and Natixis
Distribution, LLC
51
None
Significant experience
on the Board; experience
as President and Chief
Executive Officer of
Natixis Advisors, LLC
and Natixis
Distribution, LLC
1
Each Trustee serves until retirement, resignation or removal from the Board. The current retirement age is 75. The position of Chairperson of the Board is
appointed for a three-year term.
2
The Trustees of the Trusts serve as Trustees of a fund complex that includes all series of the Natixis Funds Trust I, Natixis Funds Trust II, Natixis Funds Trust IV,
Gateway Trust, Loomis Sayles Funds I, Loomis S ayles Funds II, Natixis ETF Trust and Natixis ETF Trust II (collectively, the “Fund Complex”).
3
Mr. Charleston is deemed an “interested person” of the Trusts because he holds the following positions with an affiliated person of the Trusts: President, Chief
Executive Officer and Chairman of the Board of Directors of Loomis, Sayles & Company, L.P.
4
Mr. Giunta is deemed an “interested person” of the Trusts because he holds the following positions with an affiliated person of the Trusts: President and Chief
Executive Officer, Natixis Advisors, LLC and Natixis Distribution, LLC.
T
rustee and Officer Information
|
10
4

Name and Year of Birth
Position(s) Held
with the Trusts
Term of Office
1
and Length
of Time Served
Principal Occupation(s)
During Past 5 Years
2
OFFICERS OF THE TRUSTS
Matthew J. Block
(1981)
Treasurer, Principal
Financial and
Accounting Officer
Since 2022 Senior Vice President, Natixis
Advisors, LLC and Natixis
Distribution, LLC; formerly,
Vice President, Natixis
Advisors, LLC and Natixis
Distribution, LLC; Assistant
Treasurer of the Fund
Complex
Susan McWhan Tobin
(1963)
Secretary and Chief
Legal Officer
Since 2022 Executive Vice President,
General Counsel and
Secretary, Natixis
Advisors, LLC and Natixis
Distribution, LLC; formerly,
Executive Vice President and
Chief Compliance Officer of
Natixis Investment Managers
(March 2019 – May 2022)
and Senior Vice President and
Head of Compliance, U.S. for
Natixis Investment Managers
( July 2011 – March 2019)
Natalie R. Wagner
(1979)
Chief Compliance
Officer, Assistant
Secretary and
Anti-Money
Laundering Officer
Since 2021 Senior Vice President, Natixis
Advisors, LLC and Natixis
Distribution, LLC; formerly,
Vice President, Head of
Corporate Compliance,
Global Atlantic Financial
Group
1
Each officer of the Trusts serves for an indefinite term in accordance with the Trusts' current by-laws until the date his or her successor is elected and qualified, or
until he or she sooner dies, retires, is removed or becomes disqualified.
2
Each person listed above, except as noted, holds the same position(s) with the Fund Complex. Previous positions during the past five years with Natixis
Distribution, LLC, Natixis Advisors, LLC or Loomis, Sayles & Company, L.P. are omitted, if not materially different from an officer’s current position with suc h
entity.
Trustee and Officer Information
1
05
|
This Page Intentionally Left Blank

>
To learn more about Natixis Funds products and services:
Visit: im.natixis.com Call: 80
0-225-5478
Before investing, consider the fund’s investment objectives, risks, char g es, and
expenses. Visit im.natixis.com or call 800-225-5478 f or a pr ospect us or summary
pr ospect us containing this and other information.
Contact
us by mail:
If you wish to communicate with the funds’ Board of
Trustees, you may do so by writing to:
Secretary of the Funds
Natixis Advisors, LLC
888 Boylston Street, Suite 800
Boston, MA 02199-8197
The correspondence must (a) be signed by the shareholder;
(b) include the shareholder’s name and address; and
(c) identify the fund(s), account number, share class, and
number of shares held in that fund, as of a recent date.
Or by e-mail:
recommendations for Trustee candidates may not be
submitted by e-mail.)
Please note: Unlike written correspondence, e-mail is not secure.
Please do NOT include your account number, Social Security number,
PIN, or any other non-public personal information in an e-mail
communication because this information may be viewed by others.
This page not part of shareholder report
Exp. 3/1/2025
6255481.1.1
EF58A-1223
